
Image
|
Figure Caption
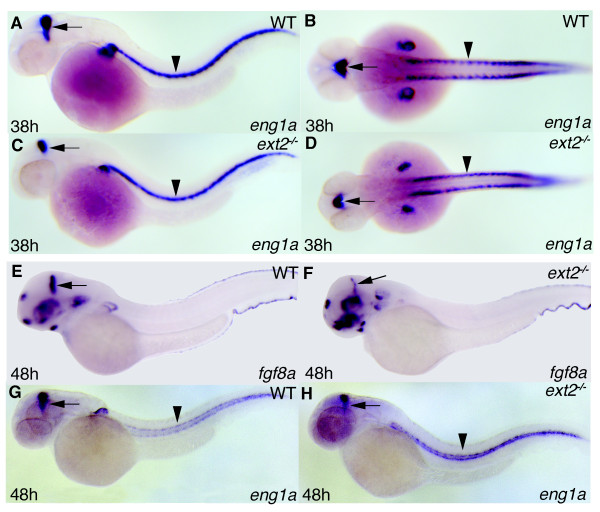
Fig. 2 Reduced expression of eng1a and fgf8a in MHB but normal eng1a expression in muscle pioneers. Lateral view (A, C, E-H) and dorsal view (B, D) of 38 hpf (A-D) and 48 hpf (E-H) embryos. Expression of eng1a and fgf8a in ext2 mutants (C, D, F, H) and WT embryos (A, B, E, G). The arrows label the MHB and arrowheads label muscle pioneer cells.
Acknowledgments
This image is the copyrighted work of the attributed author or publisher, and
ZFIN has permission only to display this image to its users.
Additional permissions should be obtained from the applicable author or publisher of the image.
Full text @ BMC Dev. Biol.