
Image
|
Figure Caption
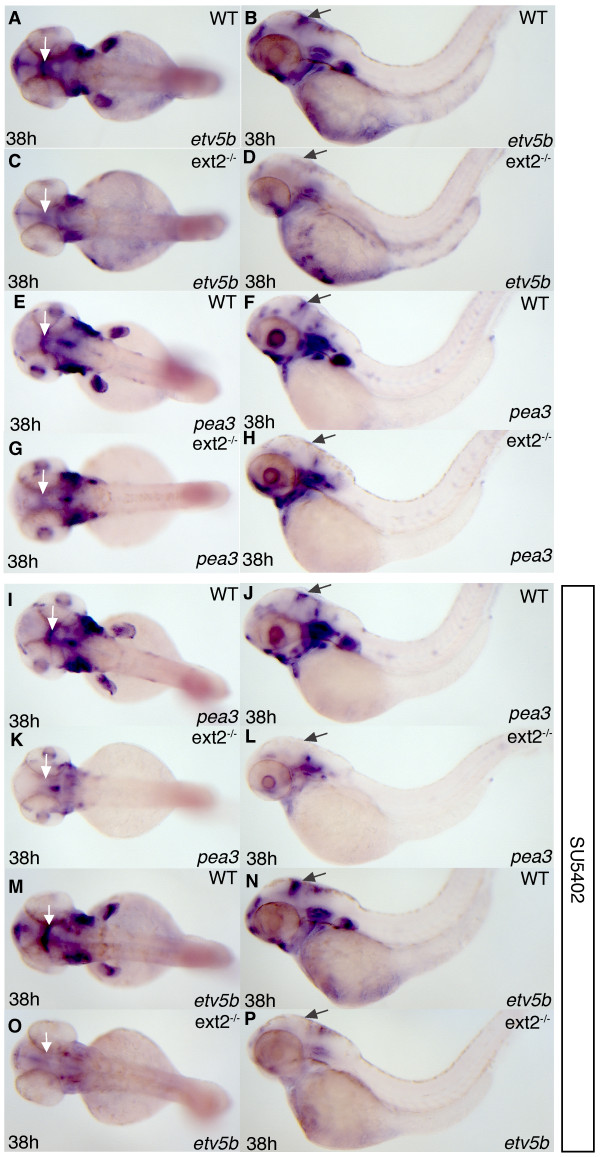
Fig. 1 etv5b and pea3 expression is reduced in ext2 mutants. Lateral view (left panels) and dorsal view (right panels) of etv5b (A-D, M-P) and pea3 (E-L) expression in 38 hpf ext2 mutants (C, D, G, H, K, L, O, P) and WT embryos (A, B, E, F, I, J, M, N). (I-P) Embryos treated with 8 μM SU5402 3 h prior to fixation. Note that pea3 expression in WT embryos is only marginally affected by the inhibitor (compare E-F with I-J) while pea3 expression is almost completely inhibited by the same treatment in ext2 mutants (compare G-H with K-L). The arrows label the MHB.
Acknowledgments
This image is the copyrighted work of the attributed author or publisher, and
ZFIN has permission only to display this image to its users.
Additional permissions should be obtained from the applicable author or publisher of the image.
Full text @ BMC Dev. Biol.