
Fig. 1
- ID
- ZDB-IMAGE-110928-9
- Genes
- Publication
- Xie et al., 2011 - Zebrafish foxo3b Negatively Regulates Canonical Wnt Signaling to Affect Early Embryogenesis
- All Figures
- Figures for Xie et al., 2011
|
Fig. 1
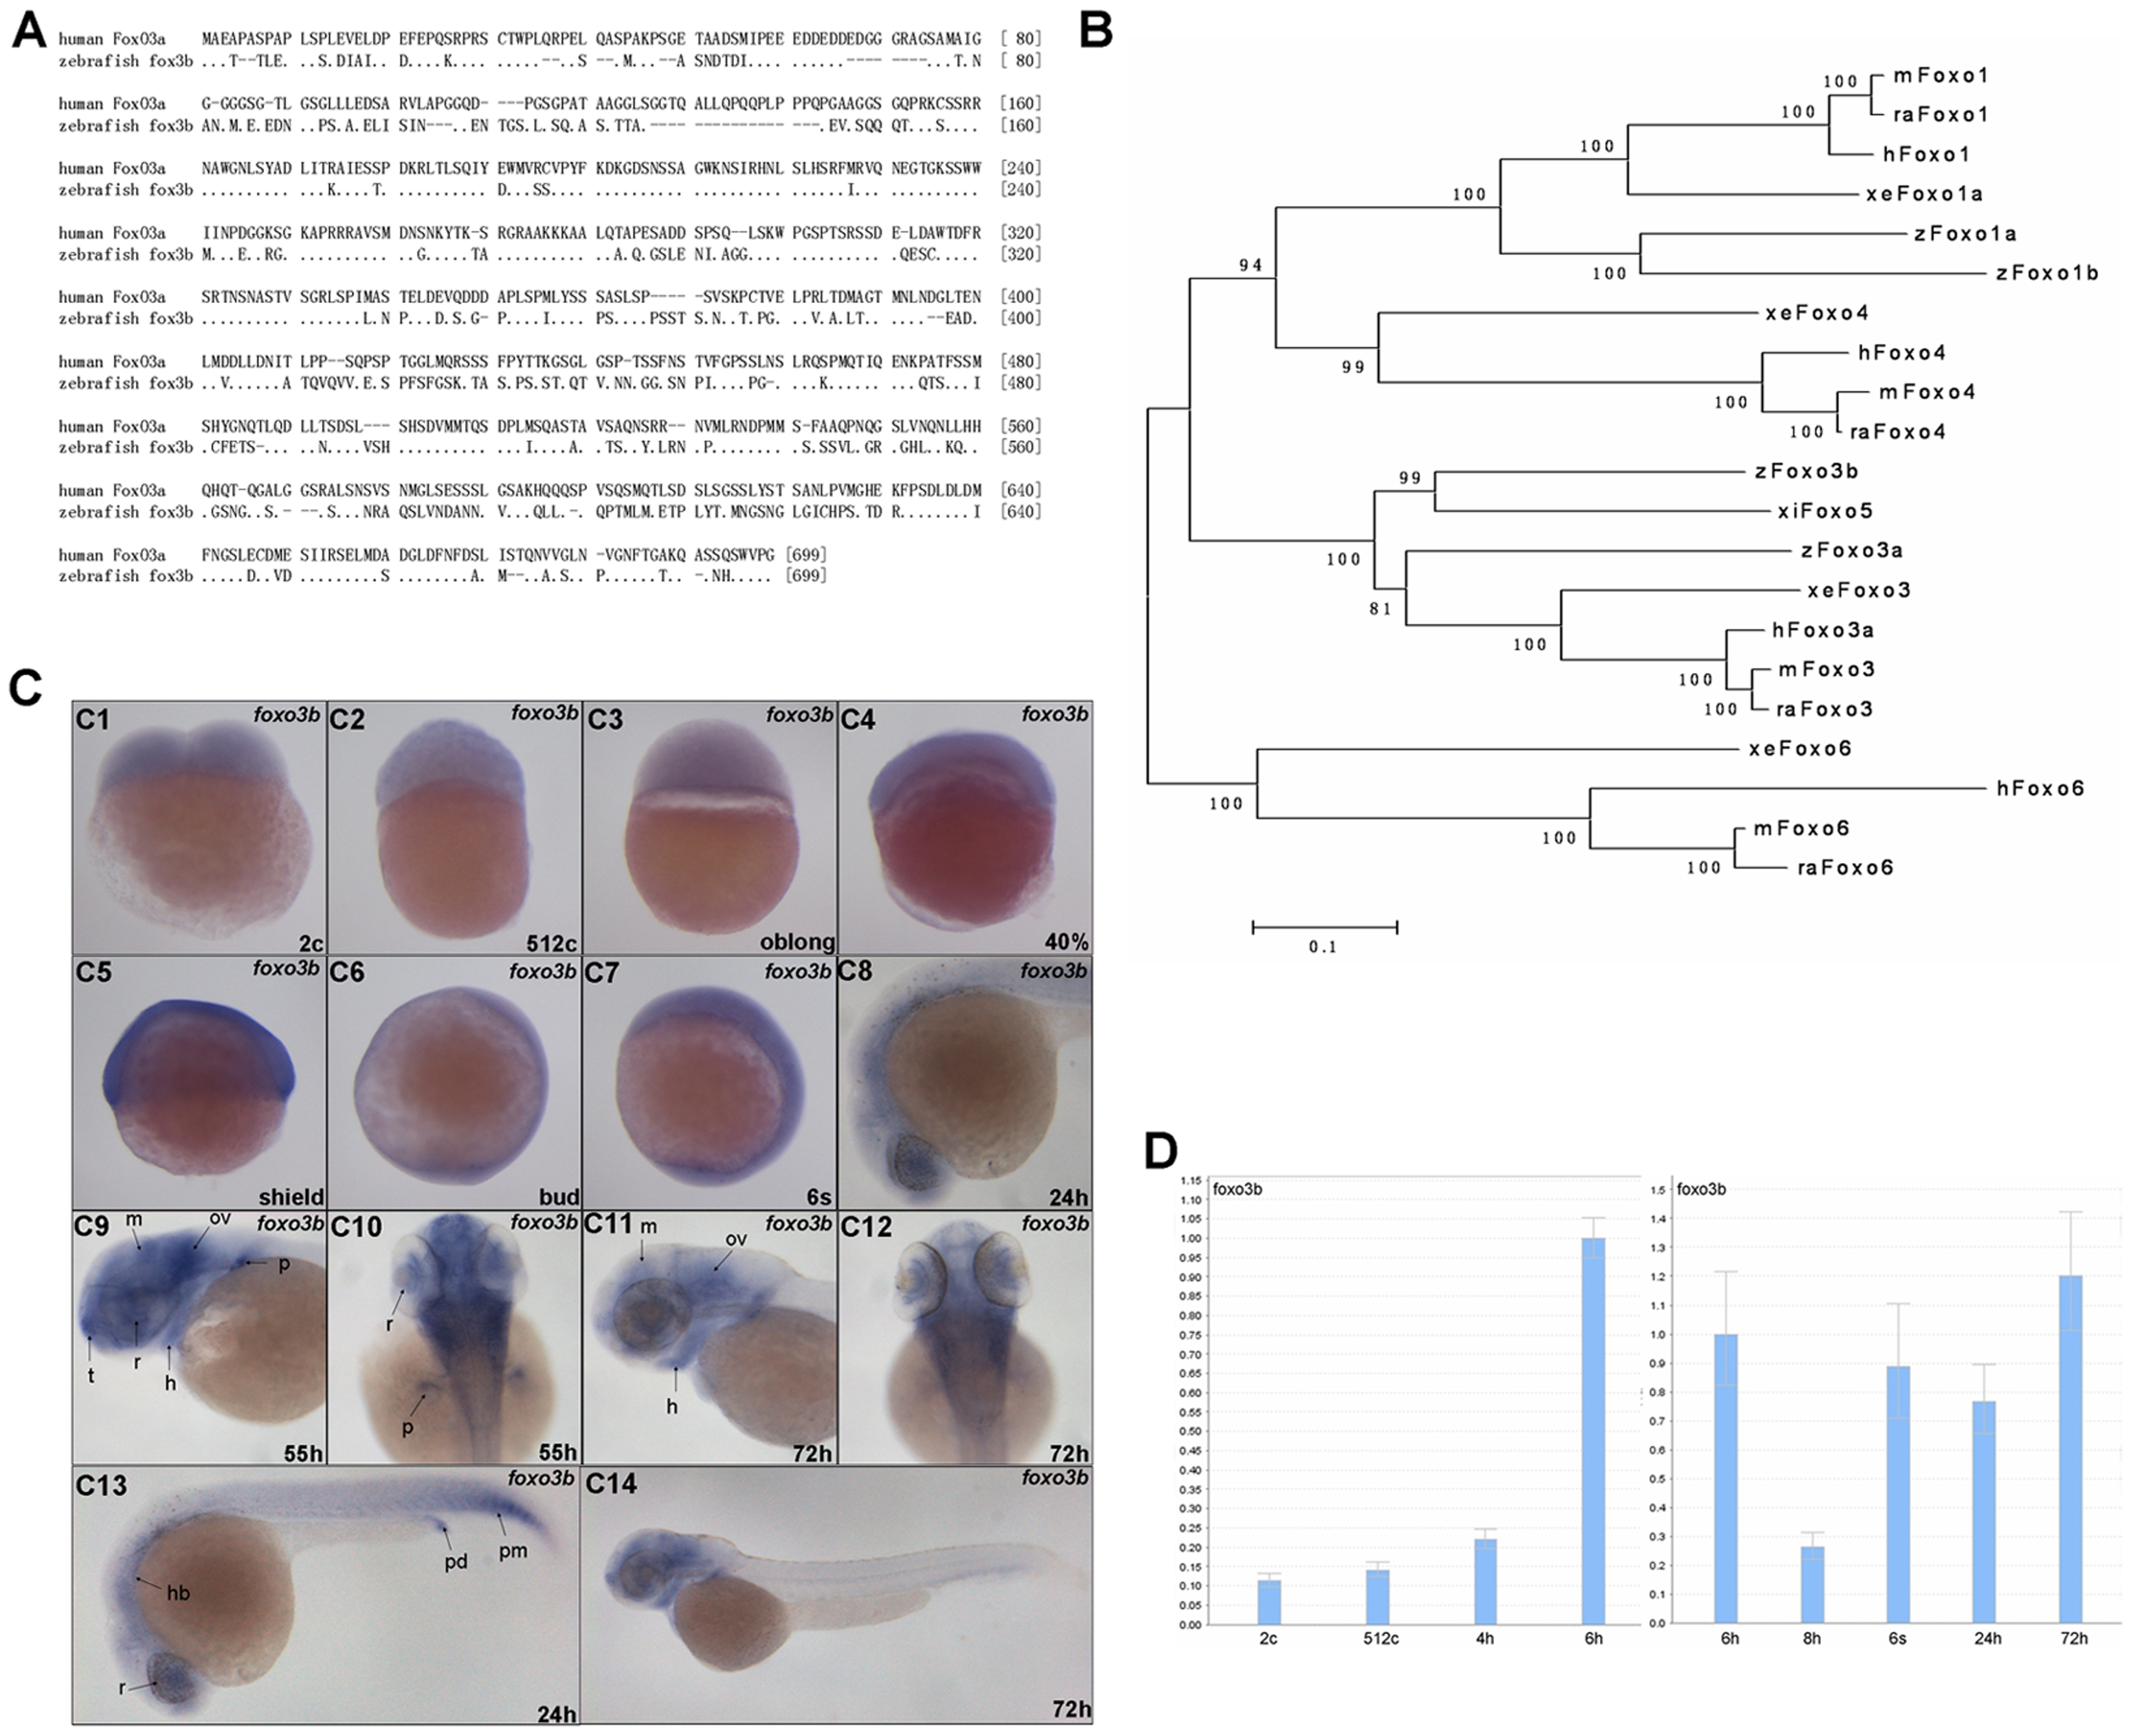
Sequence comparison of zebrafish foxo3b with other FOXOs and developmental expressing patterns of zebrafish foxo3b.
(A) Sequence alignment of zebrafish foxo3b and human FOXO3a protein. (B) Neighbor-Joining Analysis of vertebrate FOXO protein sequences. Phylogenetic analysis was conducted using MEGA version 5 (Tamura, Peterson, Stecher, Nei, and Kumar 2011). hFoxo3a (Homo sapiens, Accession number NM_001455), hFoxo6 (XM_002342102), hFoxo4 (NM_005938), hFoxo1 (NM_002015), mFoxo3 (Mus musculus, NM_019740), mFoxo6 (NM_194060), mFoxo4 (NM_018789), mFoxo1 (NM_019739), raFoxo3 (Rattus norvegicus, NM_001106395), raFoxo6 (XM_001057233), raFoxo4 (NM_001106943), raFoxo1 (NM_001191846), zFoxo3b (Danio rerio, NM_131085), zFoxo3a (NM_001009988), zFoxo1a (NM_001077257), zFoxo1b (NM_001082857), xeFoxo3 (Xenopus laevis, NM_001092949), xeFoxo6 (NM_001159282), xeFoxo4 (FJ811896), xeFoxo1a (NM_001092948), xifoxo5 (Xiphophorus maculates, AY040320). NJ bootstrap values were shown on the branches. (C) The expression pattern of zebrafish foxo3b during embryogenesis. (C1–C3) The expression of foxo3b was detected at 2-cell stage embryos, and became weaker at oblong stage. (C4, C5) Foxo3b was ubiquitously expressed at 40% epiboly stage, a stronger expression was observed at shield stage. (C6, C7) Foxo3b became weaker at bud stage; at 6-somite stage, its expression level almost recovered to that of shield stage embryos. (C8, C13) Foxo3b was observed in the developing eye, hindbrain and posterior mesoderm by 24 hpf. (C9, C10) By 55 hpf, foxo3b expression was confined to the anterior central nervous system (CNS), with weak expression in the heart. (C11, C12, C14) By 72 hpf, foxo3b expression became weaker, but continued in the CNS and heart. C1–C4, lateral view; C5, lateral view with dorsal to the right; C6, C7, lateral view with anterior on top; C8, C9, C11, C13, C14, lateral views with anterior to the left; C10, C12, dorsal views with anterior on top; r, retina; p, pectoral fin bud; hb, hindbrain; pm, posterior mesoderm; pd, pronephric duct; h, heart; t, telencephalon; ov, otic vesicle; m, mesencephalon; c, cell; s, somite; h, hours post-fertilization (hpf). (D) Relative RNA expression levels as determined by semi-quantitative RT-PCR. For each stage, oligo dT-primed cDNA was used as template for three separate PCR amplifications using primers for foxo3b and 18s (internal control), foxo3b reached a high expression level at shield stage. For quantitative purpose, mRNA expression levels were normalized to 6 hpf (1.00).