
Fig. 3
- ID
- ZDB-IMAGE-110816-24
- Genes
- Publication
- Fernando et al., 2010 - Temporal and spatial expression of CCN genes in zebrafish
- All Figures
- Figures for Fernando et al., 2010
|
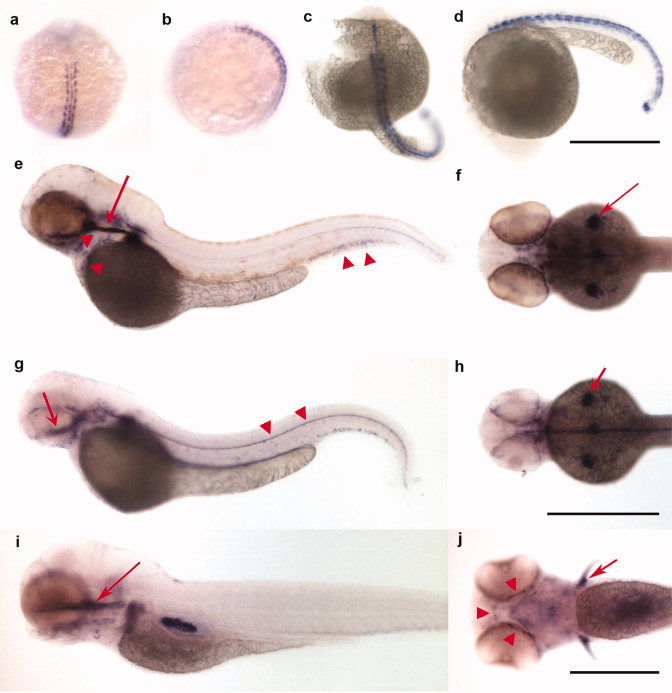
Fig. 3 Expression pattern of zCTGF-c20 detected by in situ hybridization. a-j: Photographs of zebrafish embryos staged at 5- to 8-somites (a,b), and at 24 (c,d), 48 (e,f), 70 (g,h), and 96 (i,j) hpf. Expression is observed in adaxial cells of developing somites and in the floor plate at the 5-8 somite stage (a, dorsal view; b, lateral view) and at 24 hpf (c,d). Later during development, expression is seen along the notochord (e-h, arrowhead in g), heart and axial vasculature (e, arrowheads), ethmoid plate (e,g,i, arrows), pectoral fin buds (f,h, arrows), pectoral fins and developing mandibular arch (j, arrow and arrowheads, respectively). Scale bars = 500 μm for all figures except 96 hpf, where bar = 200 μm.