
Image
|
Figure Caption
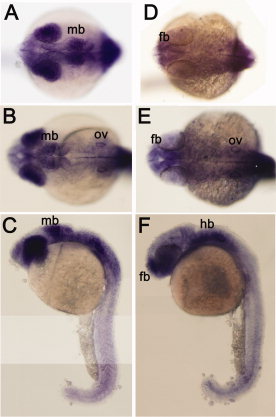
Fig. 5 Comparison of expression pattern of sbno1 and sbno2a at pharyngula (24 hours postfertilization [hpf]) stage. A-C: Strong expression of sbno1 was observed in the midbrain (presumptive tectal region) and the eyes at this stage. D-F: Expression of sbno2a is relatively high in the forebrain region at this stage. A and D are focusing on the forebrain region. B and E focus on the hindbrain region. C and F are lateral views of embryos with ventral to the left. fb, forebrain; hb, hindbrain; mb, midbrain; ov, otic vesicle.
Figure Data
Acknowledgments
This image is the copyrighted work of the attributed author or publisher, and
ZFIN has permission only to display this image to its users.
Additional permissions should be obtained from the applicable author or publisher of the image.
Full text @ Dev. Dyn.