
Image
|
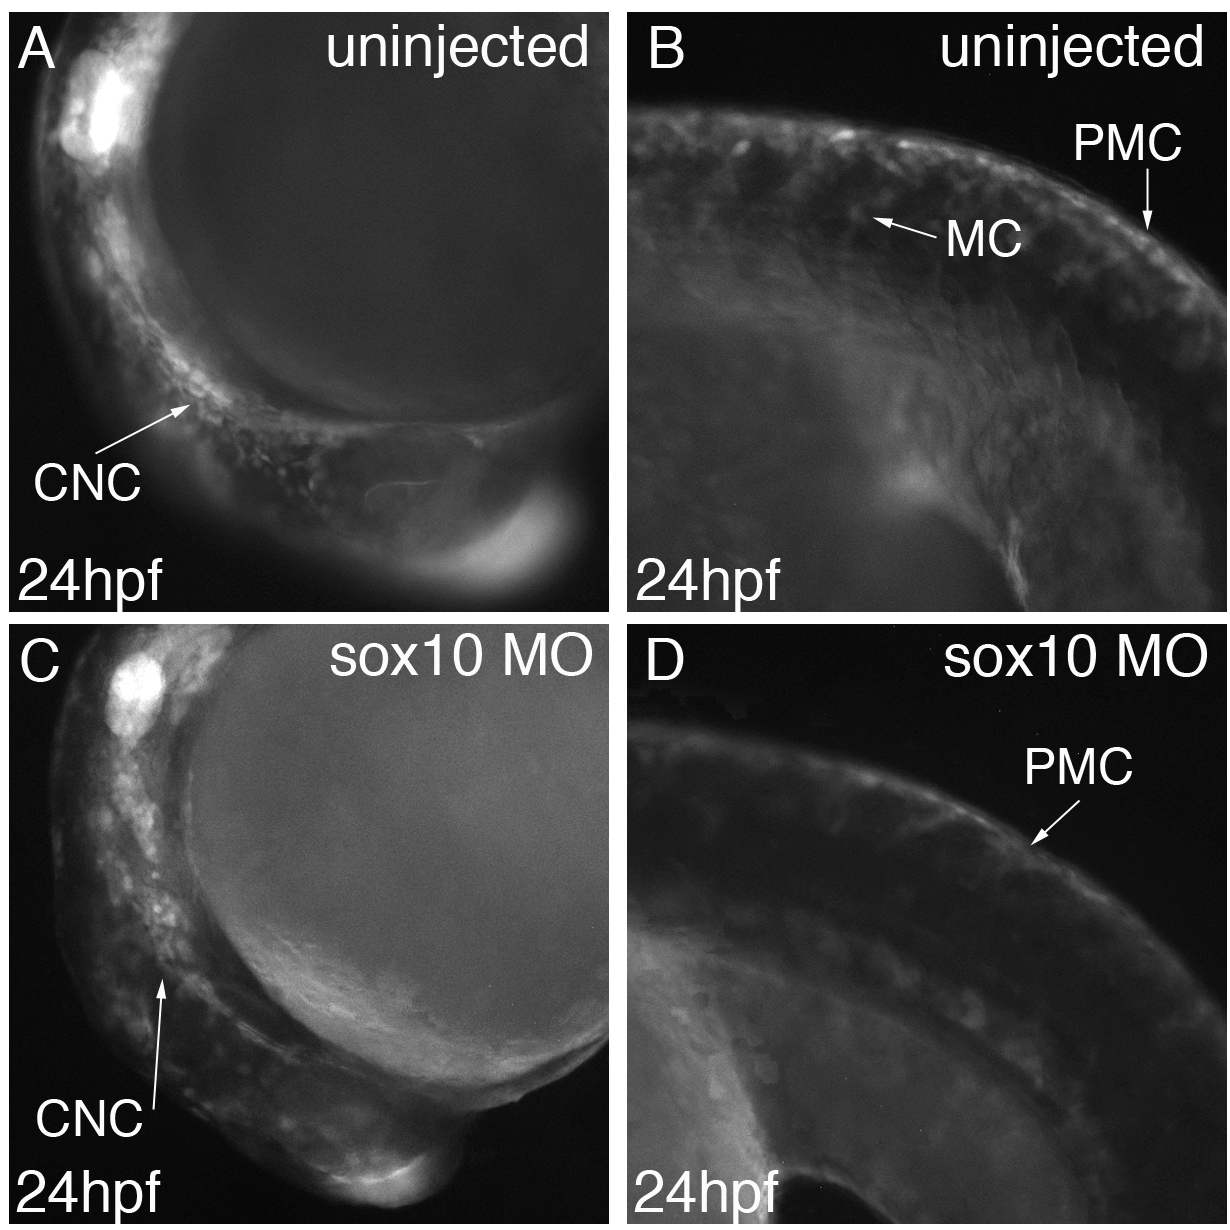
Figure Caption
Fig. S6
Range of eGFP phenotypes in ERBB3_MCS6 transgenic fish upon sox10 morpholino injection. (A-B) eGFP expression driven by ERBB3_MCS6 in uninjected fish at 24hpf. Expression is noted in cranial neural crest (CNC), premigratory NC (PMC) and migratory crest (MC) (C-D) Fewer eGFP positive CNC (C) and PMC cells seen in sox10 morpholino injected transgenic embryos, and significantly reduced numbers of MC (D).
Acknowledgments
This image is the copyrighted work of the attributed author or publisher, and
ZFIN has permission only to display this image to its users.
Additional permissions should be obtained from the applicable author or publisher of the image.
Full text @ BMC Dev. Biol.