
IMAGE
Fig. 3
- ID
- ZDB-IMAGE-110719-8
- Genes
- Publication
- Li et al., 2011 - Zebrafish krüppel-like factor 4a represses intestinal cell proliferation and promotes differentiation of intestinal cell lineages
- All Figures
- Figures for Li et al., 2011
Image
|
Figure Caption
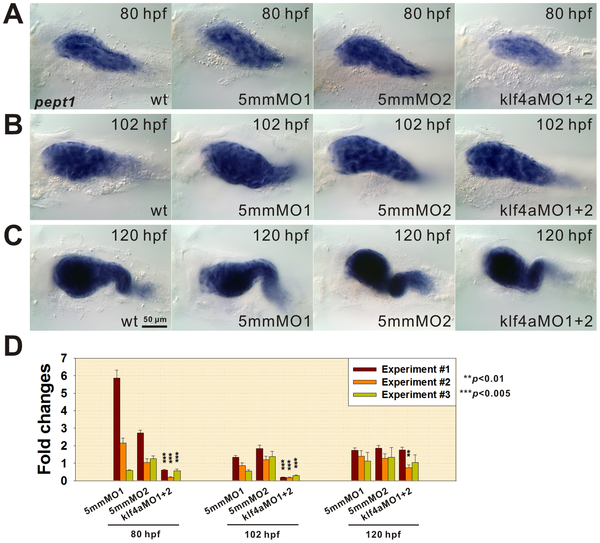
Fig. 3
Decreased PepT1 expression is detected in klf4a morphants.
PepT1 expression comparison among 80- (A), 102- (B), and 120-hpf (C) klf4a-MO1 and klf4a-MO2-injected morphants, klf4a-5mmMO1-, klf4a-5mmMO2-injected, and wild type embryos. (D) PepT1 expression level analyzed by qPCR. Error bars indicate the standard error. Student′s t-test was conducted to compare klf4a morphants with either wild type, klf4a-5mmMO1- or klf4a-5mmMO2-injected embryos.
Figure Data
Acknowledgments
This image is the copyrighted work of the attributed author or publisher, and
ZFIN has permission only to display this image to its users.
Additional permissions should be obtained from the applicable author or publisher of the image.
Full text @ PLoS One