
Fig. 6
- ID
- ZDB-IMAGE-110608-18
- Genes
- Publication
- Quillien et al., 2011 - BMP signaling orchestrates photoreceptor specification in the zebrafish pineal gland in collaboration with Notch
- All Figures
- Figures for Quillien et al., 2011
|
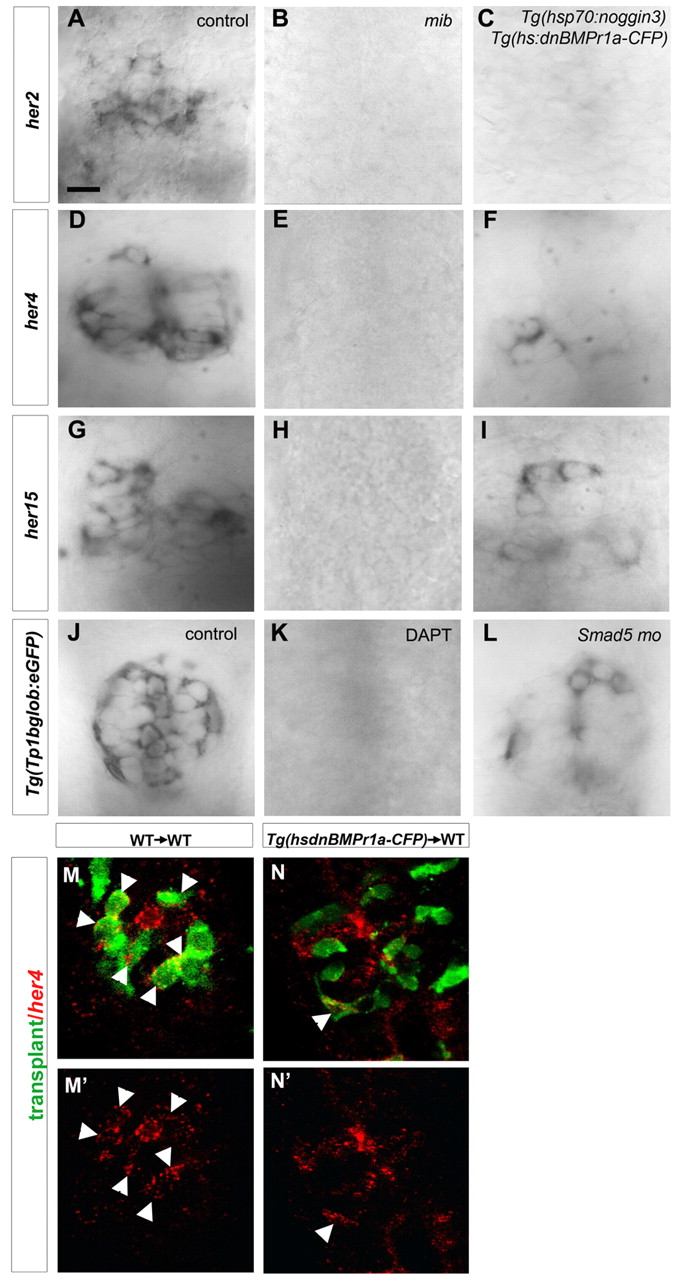
Fig. 6 BMP regulates Notch target gene expression. (A-I) Dorsal view of pineal glands showing expression of her genes in control (A,D,G), mib (B,E,H) and Tg(hs:dnBmpr1a-CFP);Tg(hsp70:noggin3) transgenic embryos (C,F,I) at 20 hours. For Tg(hs:dnBmpr1a-CFP);Tg(hsp70:noggin3) transgenic embryos, heat shocks were performed at 16 hours. (J-L) Dorsal view of pineal glands from mock-treated (J), DAPT-treated (K) or smad5-morphant (L) embryos. The effects of the various treatments were monitored by in situ hybridization against gfp transcripts in a Tg(Tp1bglob:eGFP) background. Anterior is upwards. Scale bar: 16 μm. (M-N′) Confocal sections of pineal glands of wild-type host having received cells transplanted from wild-type (M-M′) or Tg(hs:dnBmpr1a-CFP) donors (N-N′). Transplanted cells are shown in green, while expression of her4 mRNA is shown in red. White arrowheads highlight transplanted cells expressing her4.