
Image
|
Figure Caption
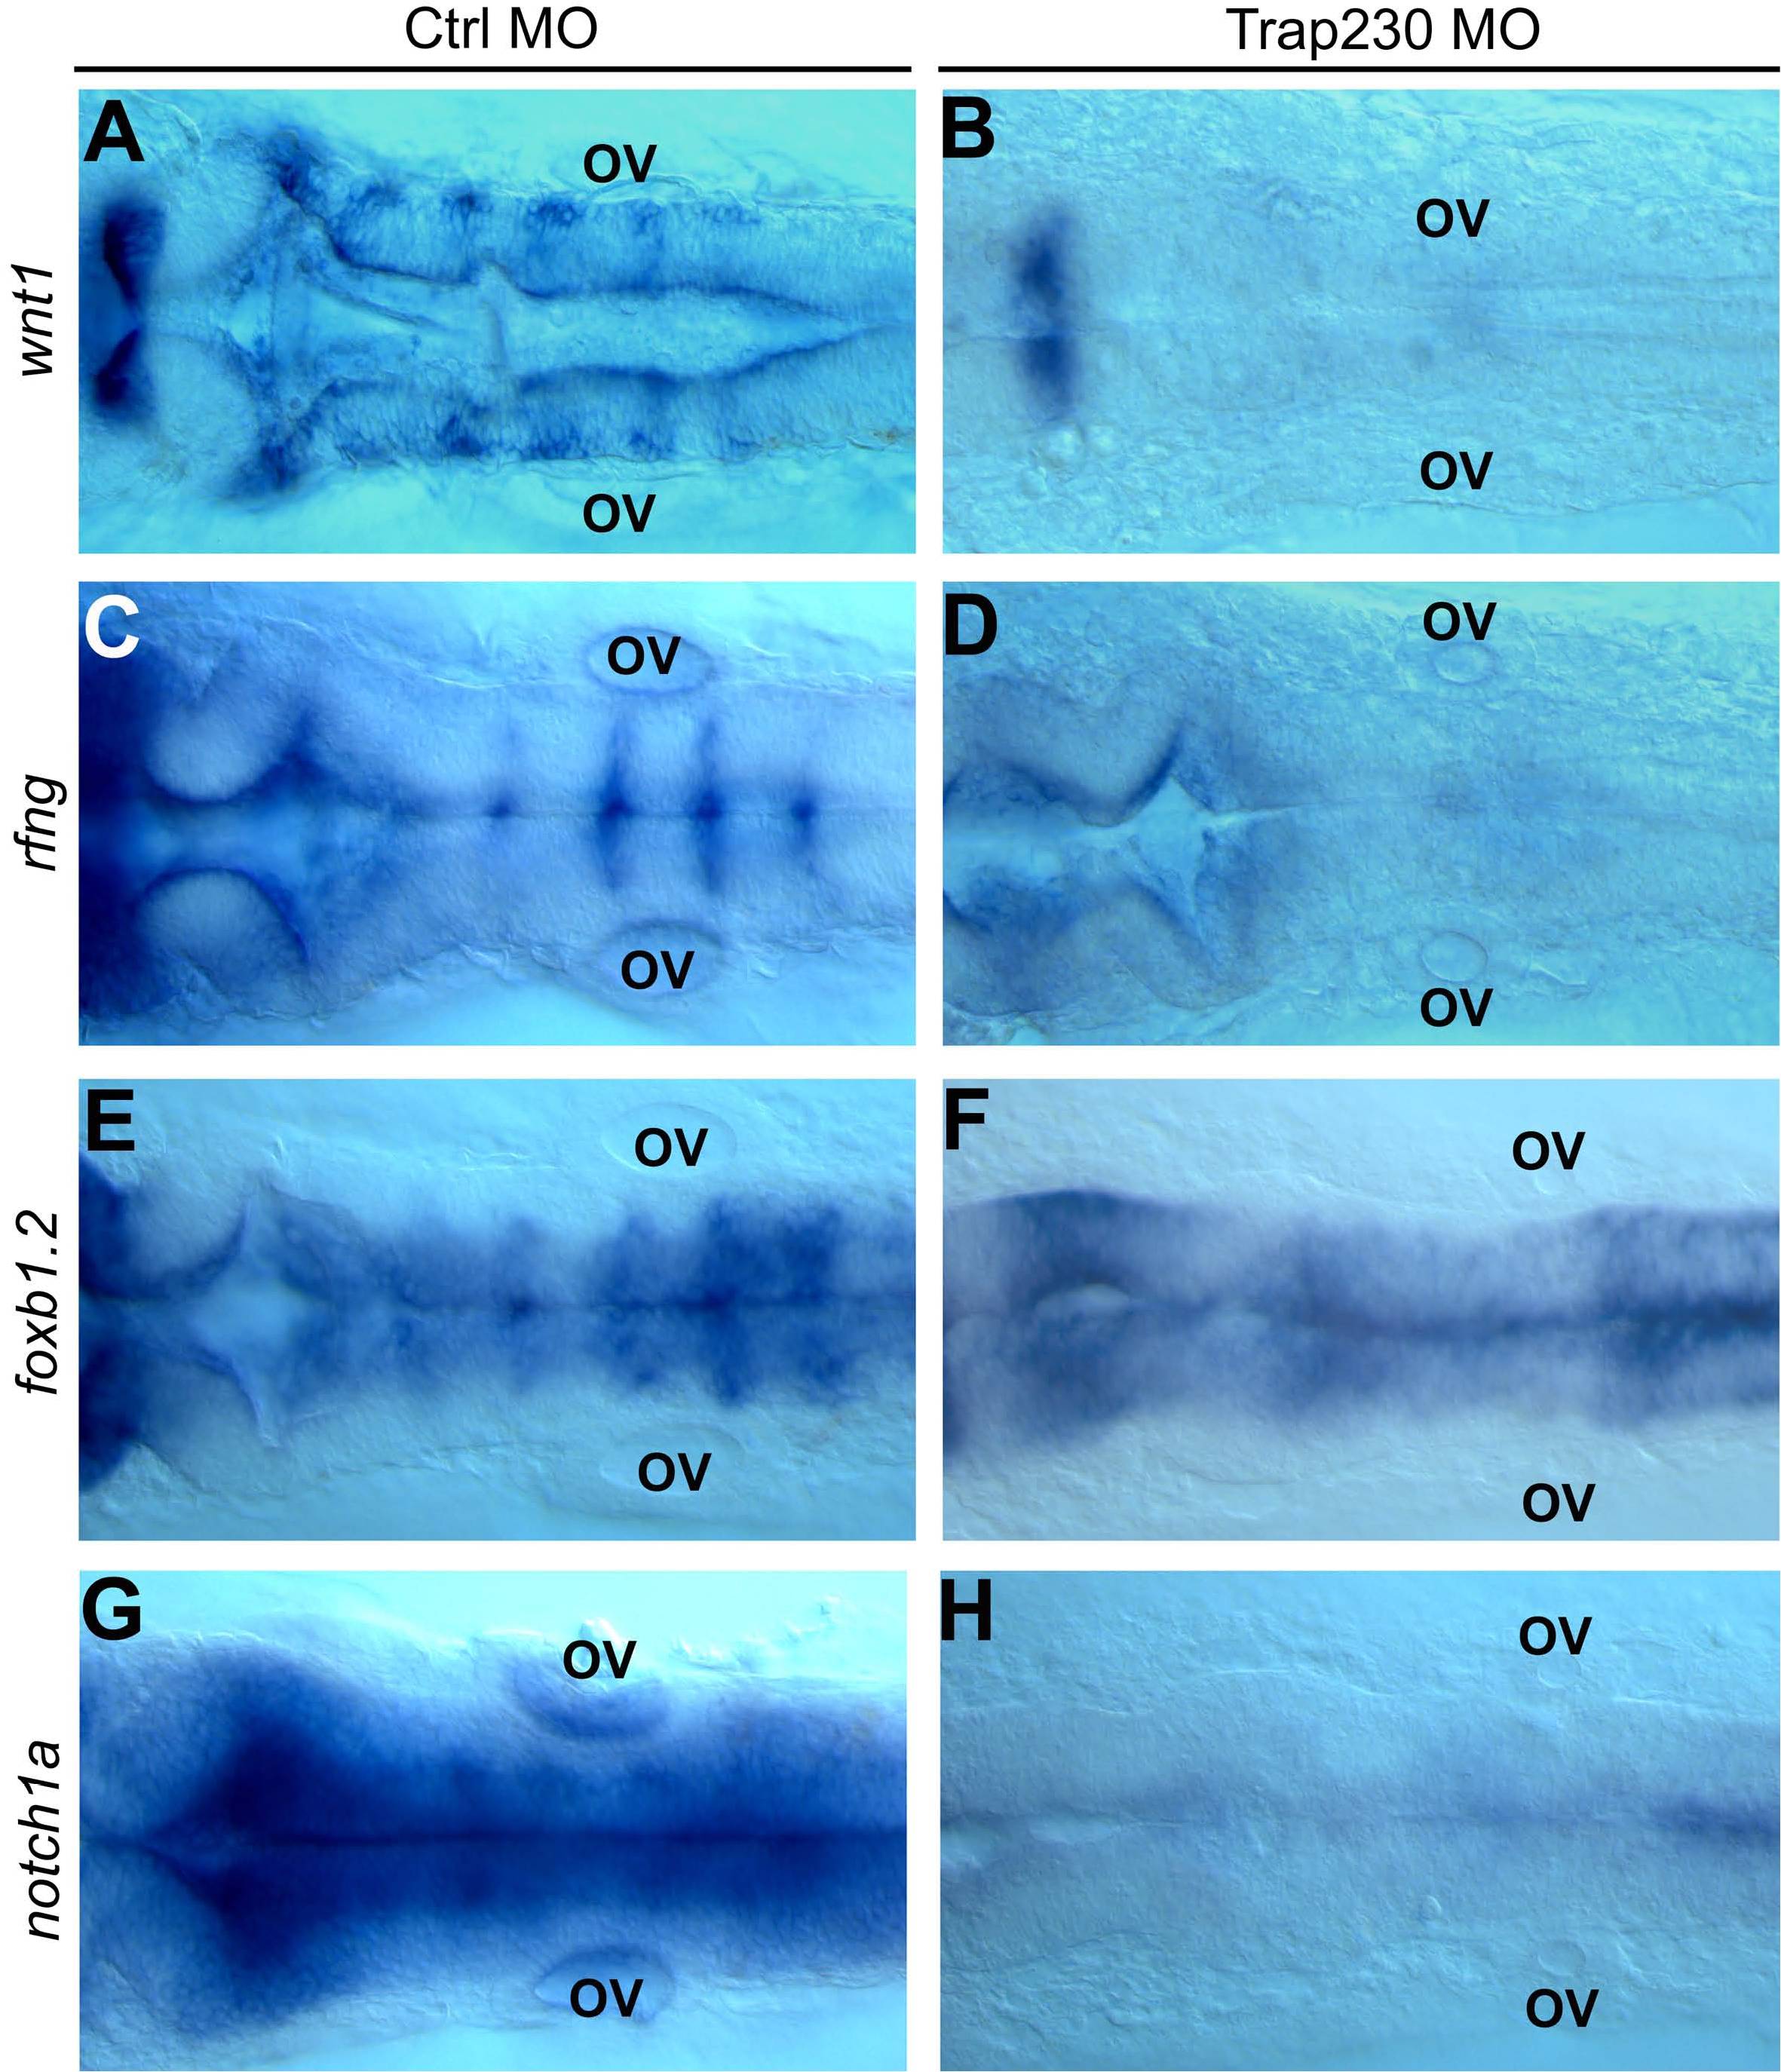
Fig. S1 Injection of Med12 MO recapitulates the hindbrain boundary phenotype of the kto mutant. All images are dorsal views of control MO (A,C,E,G) and Med12 MO (formerly called Trap230 MO) (B,D,F,H) injected embryos at 24 hpf. Wnt1 (A,B), rfng (C,D), foxb1.2 (E,F), and notch1a (G,H) were used as hindbrain boundary markers. ov, otic vesicle.
Figure Data
Acknowledgments
This image is the copyrighted work of the attributed author or publisher, and
ZFIN has permission only to display this image to its users.
Additional permissions should be obtained from the applicable author or publisher of the image.
Full text @ PLoS One