
|
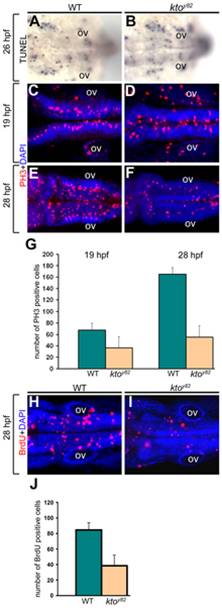
Fig. 4 Cell proliferation defects in the hindbrain of ktoy82 mutants.
All images are dorsal views at 19 hpf (C,D), 26 hpf (A,B), and 28 hpf (E,F,H,I). (A,B) Analysis of cell death using TUNEL assay. (C–G) PH3 staining (C–F), and quantification (G) of PH3 positive cells in wt and kto embryos. (H–J) BrdU staining of wt and mutant embryos (H,I), and quantification of BrdU positive cells (J). Five embryos were counted for each condition; the error bars indicate 1 standard deviation based on 5 samples. PH3 staining at 19 hpf, wt vs. kto: p = 0.003456; at 28 hpf, wt vs. kto: p = 2.97e-05. BrdU staining, wt vs. kto: p = 0.000706. ov, otic vesicle.