
Fig. 3
|
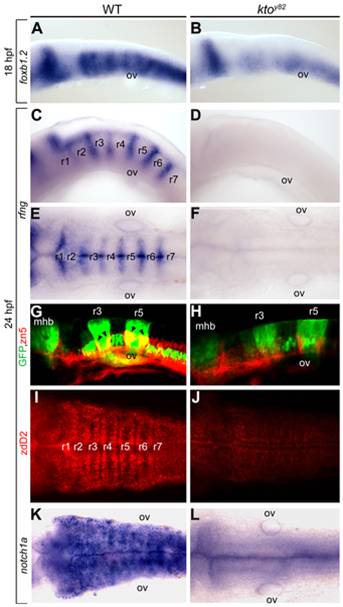
Fig. 3 Specific loss of hindbrain boundaries in ktoy82 mutants.
Lateral (A–D,G,H) and dorsal views (E,F,I–L) of wt (A,C,E,G,I,K) and ktoy82 mutant embryos (B,D,F,H,J,L) at 18 hpf (A,B) and 24 hpf (C–L). (A–F, K,L) in situ hybridization. (A,B) Expression of the earliest hindbrain boundary marker foxb1.2. (C–F) Completely loss of rfng expression in hindbrain boundaries. (G–J) Confocal images of hindbrain boundary neurons; immunostaining with zn5 (red) in pGFP-5.3 transgenic zebrafish (green) (G,H); staining with zebrafish delta D antibody, zdD2 (I,J). (K,L) notch1a expression in the hindbrain. mhb, mid-hindbrain boundary; ov, otic vesicle; r, rhombomere.