
Fig. 1
- ID
- ZDB-IMAGE-110526-7
- Genes
- Publication
- Van Raay et al., 2011 - Naked1 Antagonizes Wnt Signaling by Preventing Nuclear Accumulation of β-Catenin
- All Figures
- Figures for Van Raay et al., 2011
|
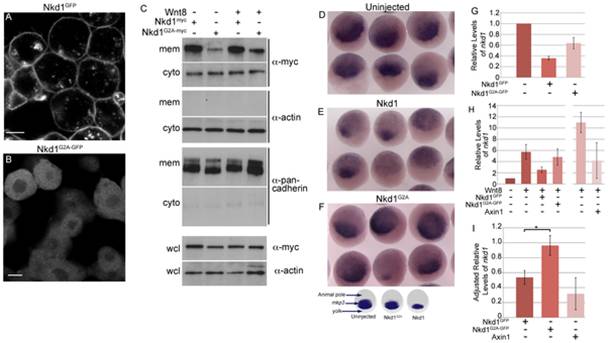
Fig. 1 Plasma membrane localized Nkd1 is required for antagonizing Wnt signaling.
nkd1GFP (A) or nkd1G2A-GFP (B) mRNA was injected into 1 of 4 blastomeres and allowed to develop until dome stage (4.3 hpf). Embryos were viewed live with confocal microscopy. (C) In a similar experiment, embryos injected at the one cell stage with either nkd1myc or nkd1G2A-myc in combination with wnt8, were collected at dome stage and fractionated into cytoplasmic (cyto) or plasma membrane (mem) fractions. Western blots of fractions were probed with anti-myc. This blot was also probed with anti-actin or anti-pancadherin to determine purity of fractions. Each lane represents the equivalent of 1 embryo from an average of 10 embryos. To determine total amount of protein, a portion of the pre-fractionated whole cell lysate (wcl) was western blotted and probed with anti-myc and anti-actin as a loading control. For the wcl, each lane represents the equivalent of 0.75 of an embryo from an average of 10 embryos. (D, E, F) Embryos were injected at the one cell stage with either nkd1 (E) or nkd1G2A (F) RNA and harvested, along with uninjected controls (D), at sphere stage (3.8 hpf). Embryos were processed for whole mount in situ hybridization using a mkp3 anti-sense probe [38]. The schematic below (F) summarizes the whole mount in situ hybridization data, identifies the different regions of the embryo and the domain of mkp3 expression in the dorsal organizer region. (G) Embryos were injected at the 1 cell stage with nkd1GFP or nkd1G2A-GFP, harvested at dome stage and total RNA was isolated and reversed transcribed. qRT-PCR was performed using endogenous nkd1 as readout. The 52 untranslated region of nkd1 was used as a target, the sequence of which was not incorporated into the expression vectors. Values are relative to uninjected embryos which was arbitrarily set to 1 (N = 3). (H) Quantification of endogenous nkd1 levels by qRT-PCR in the presence of Wnt8. (N = 6 for Wnt8; Wnt8+Nkd1GFP; Wnt8+Nkd1G2A-GFP). The Wnt8+Axin experiments (N = 3) were done independently of the others, which showed higher induction of nkd1 by Wnt8 alone, compared to the other experiments and relative to uninjected. (I) To adjust for the differences between experiments described in (H), the ratio of endogenous levels of nkd1 was determined for Wnt8+Nkd1GFP:Wnt8 (N = 6), Wnt8+Nkd1G2A-GFP:Wnt8 (N = 6) and Wnt8+Axin1:Wnt8 (N = 3) for each individual experiment and then averaged. (* = Students t-test, p = 0.0252). A level of one indicates no effect. Error bars represent standard error. Scale bar in A,B represents 10 μm.