
|
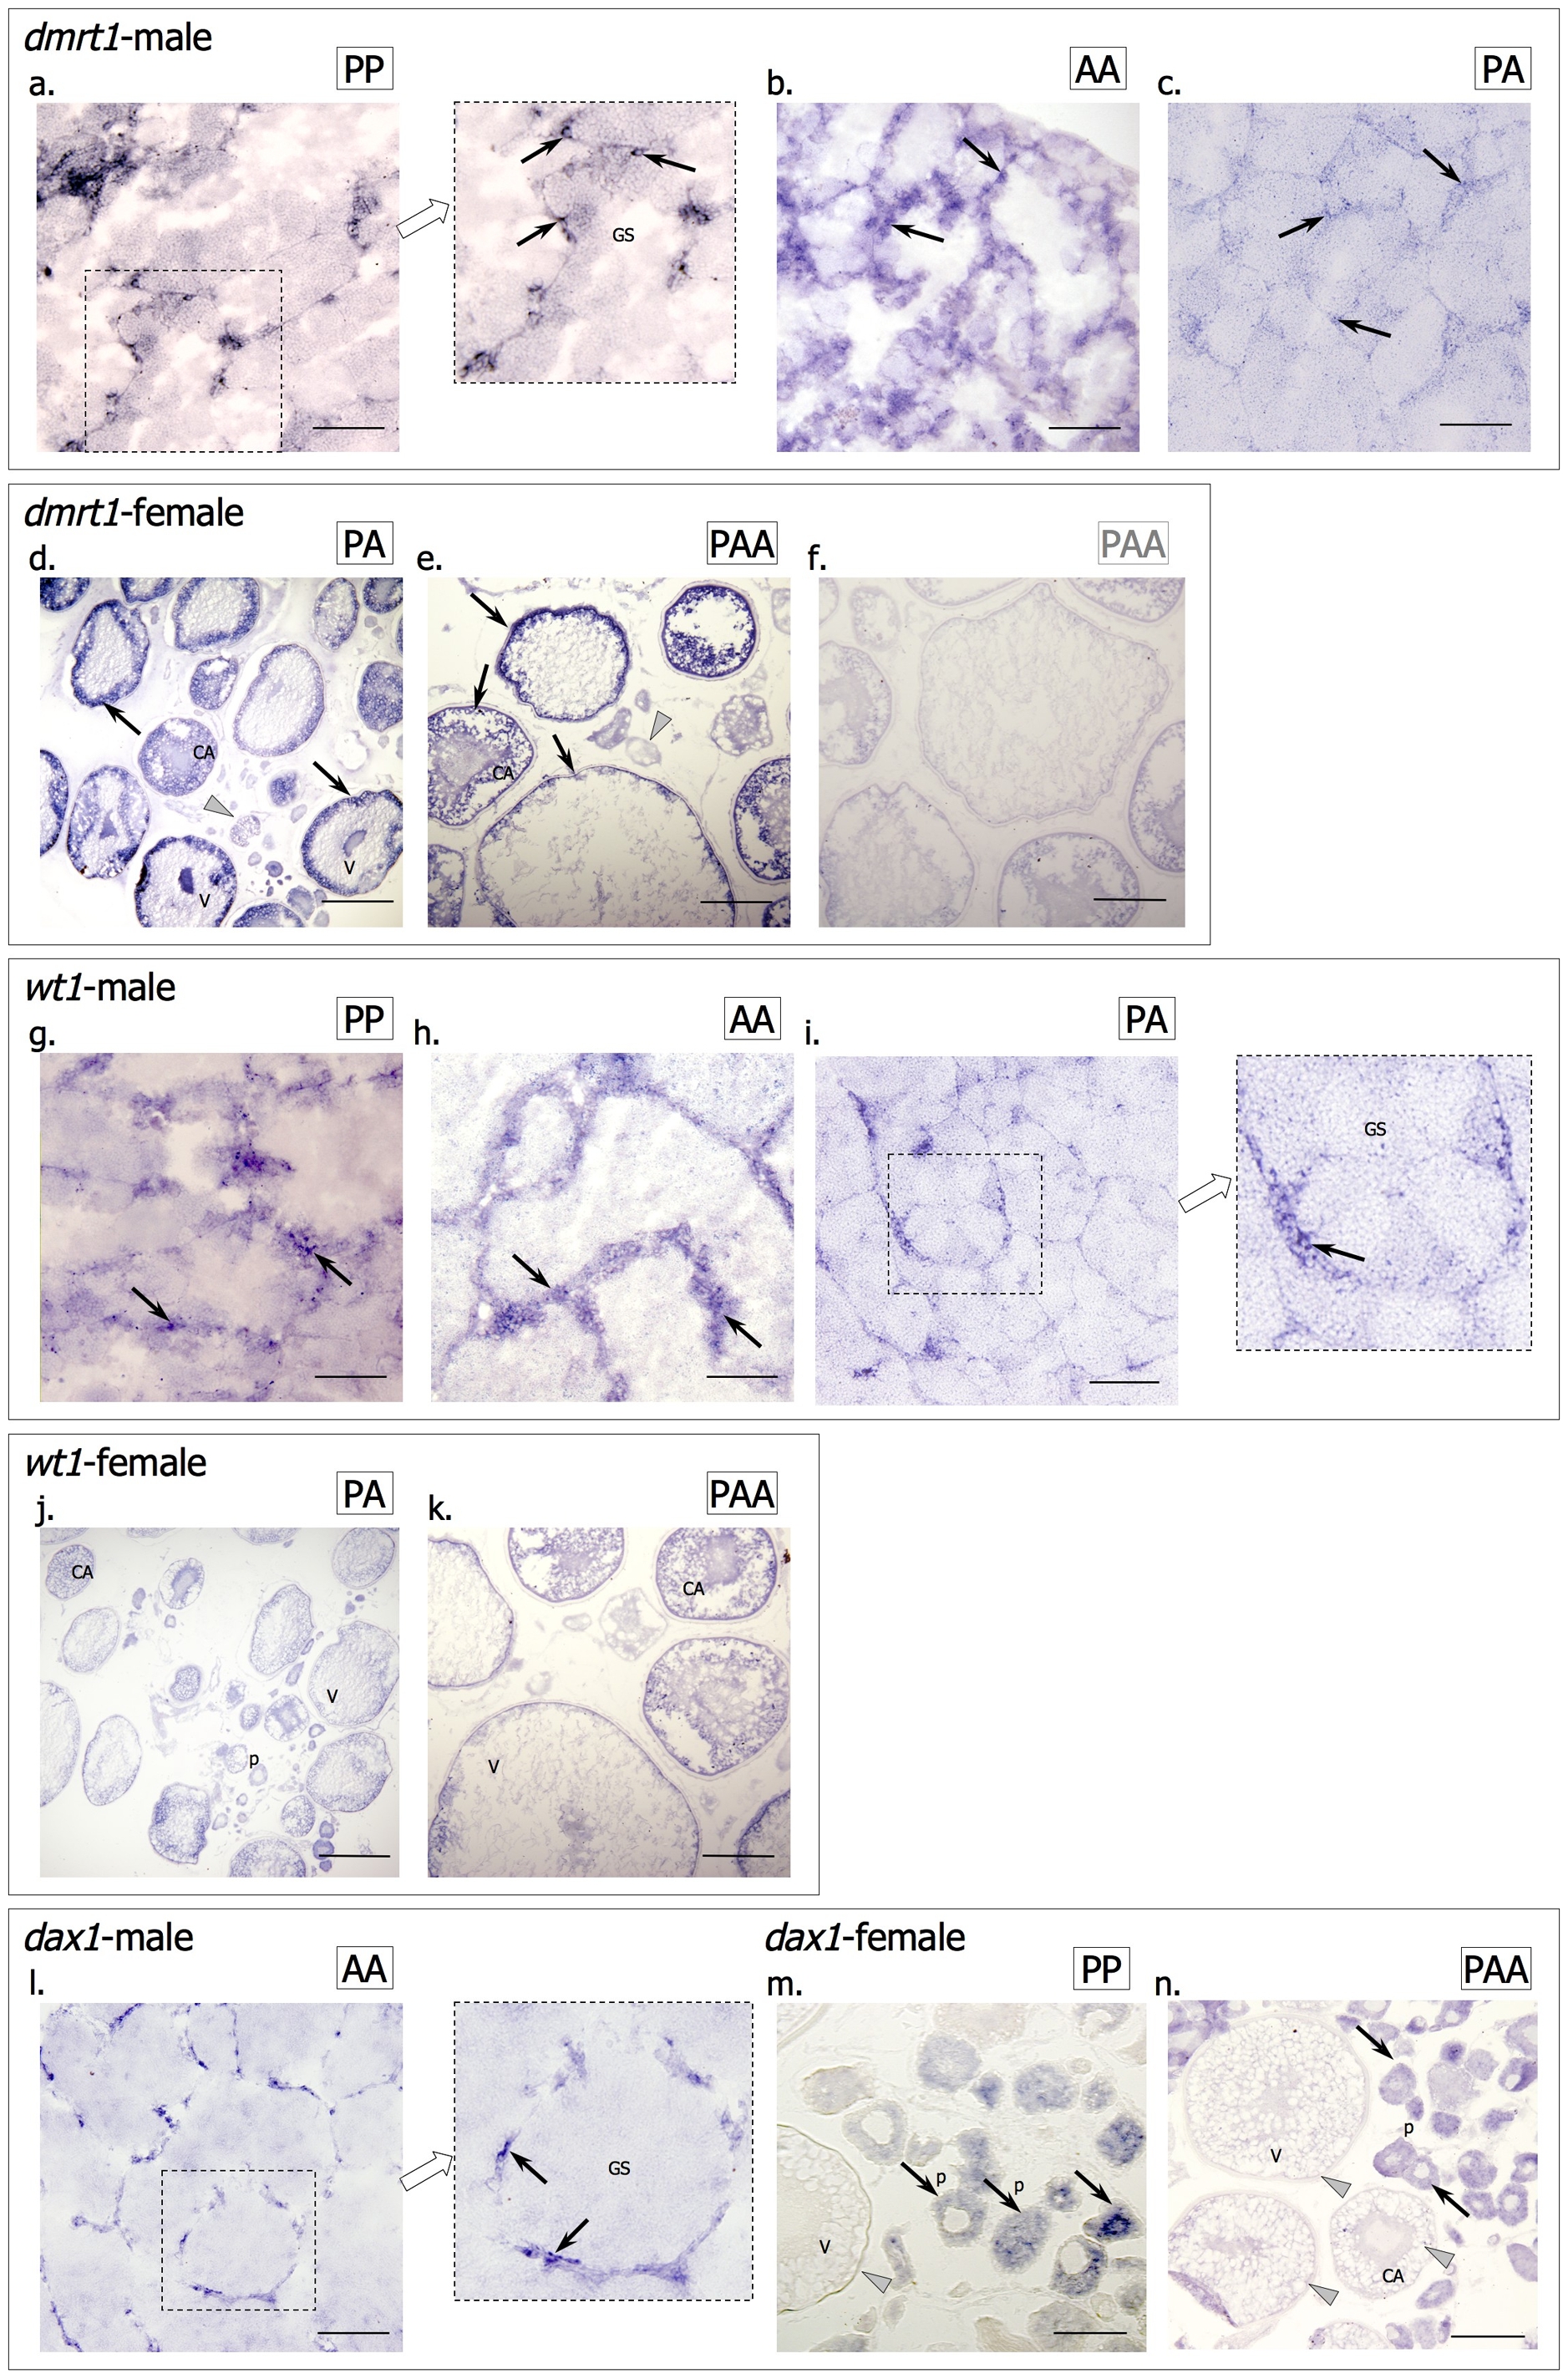
Fig. 5
Dmrt1: (a) S. pyrenaicus (PP genotype); (b) S. alburnoides (AA genotype) and (c) S. alburnoides (PA genotype) testis; (d) S. alburnoides (PA genotype) and S. alburnoides (PAA genotype) ovary with (e) antisense and (f) sense probes. Wt1: (g) S. pyrenaicus (PP genotype); (h) S. alburnoides (AA genotype) and (i) S. alburnoides (PA genotype) testis; (j) S. alburnoides (PA genotype) and (k) S. alburnoides (PAA genotype) ovary. Dax1: (l) S. alburnoides (AA genotype), (m) S. pyrenaicus (PP genotype) and (n) S. alburnoides (PAA genotype) ovary. Examples of areas with positive signal are indicated by black arrows; examples of negative cells are highlighted with grey arrowheads. Germ cells (GS), early perinuclear (P), cortical alveolar (CA) and vitellogenic (V) oocytes. Scale bar = 100 μm (a, b, e, f, g, h, k, l, m); scale bar = 200 μm (c, d, i, j, n).