
Fig. 2
- ID
- ZDB-IMAGE-110321-15
- Genes
- Publication
- Wu et al., 2011 - SNW1 Is a Critical Regulator of Spatial BMP Activity, Neural Plate Border Formation, and Neural Crest Specification in Vertebrate Embryos
- All Figures
- Figures for Wu et al., 2011
|
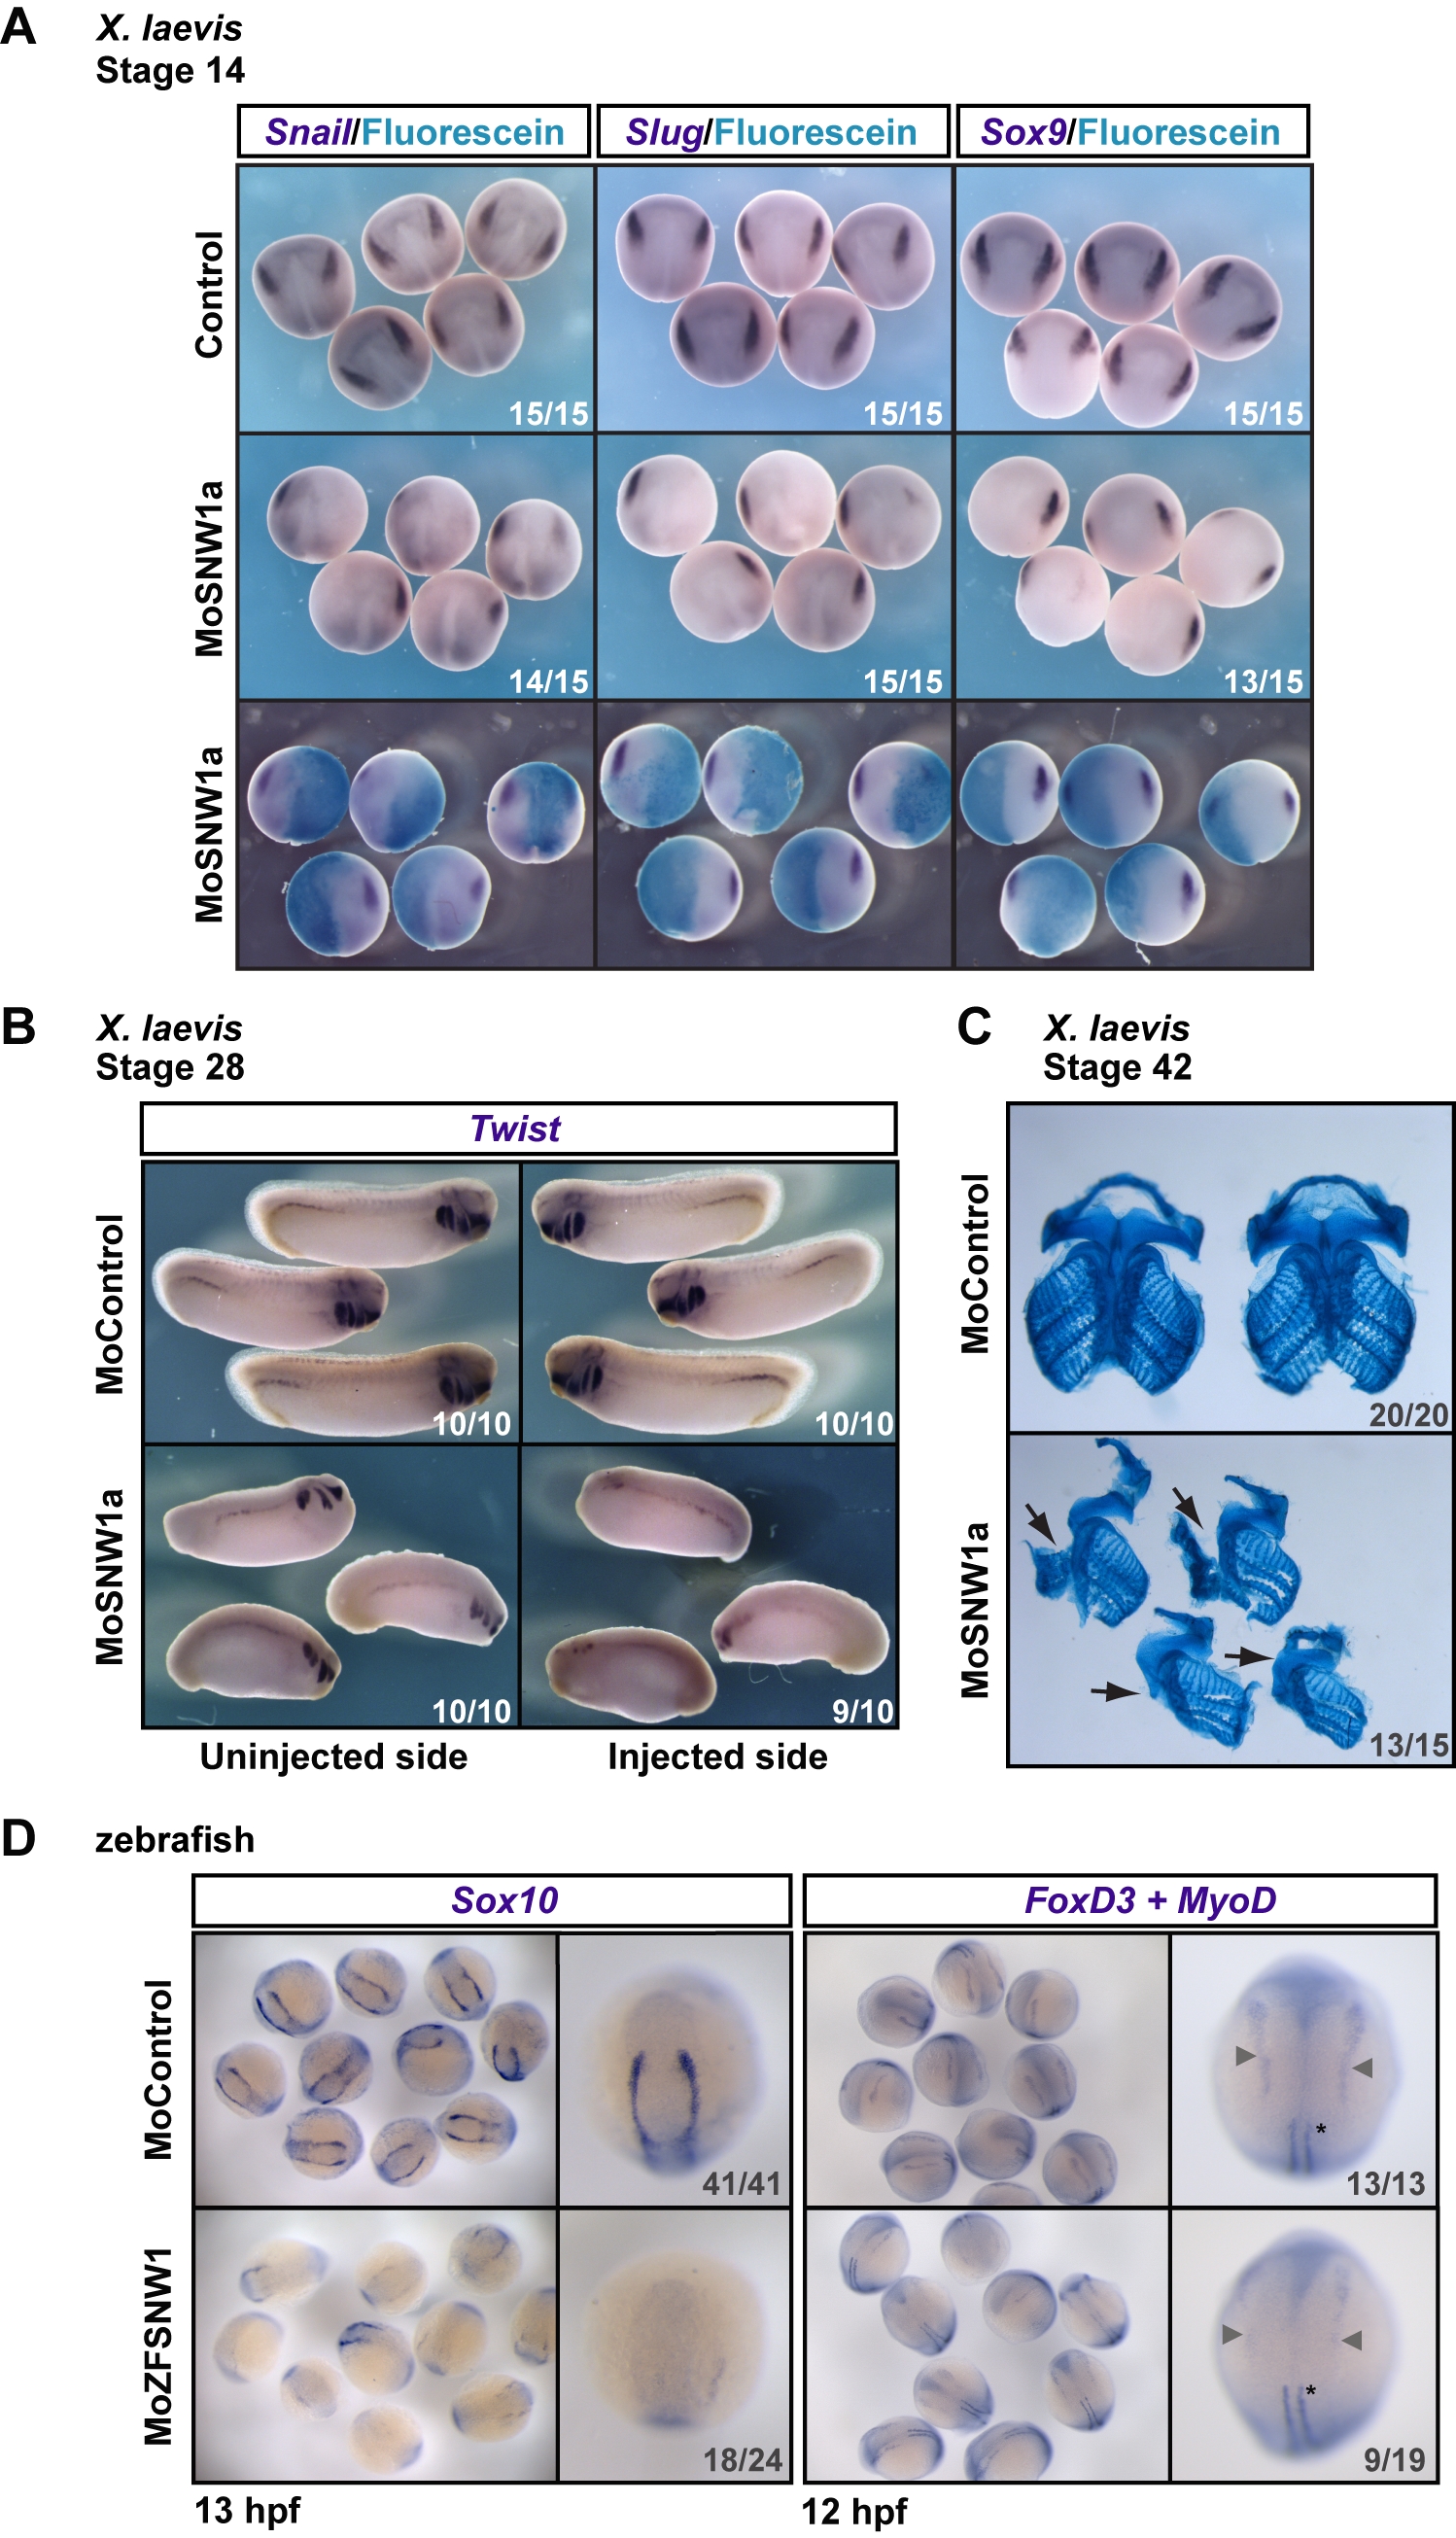
Fig. 2 SNW1 knockdown inhibits neural crest induction.
(A) Injection of MoSNW1a (Figure S3) results in the loss of neural crest markers Snail, Slug, and Sox9 on the injected side at stage 14. MoSNW1a (20 ng) was co-injected with Fdx as a tracer in one cell of a two-cell Xenopus embryo. The tracer was detected using an anti-fluorescein antibody. Control embryos were uninjected. (B) Two-cell Xenopus embryos were injected in one cell with either 20 ng of control MO (MoControl) or 20 ng of MoSNW1a. WISH was performed at stage 28 using a probe against Twist. (C) Xenopus embryos were injected with control MO or MoSNW1a as in (B). At stage 42 the facial cartilage was stained with alcian blue and then dissected. The injected side is indicated with an arrow. (D) Zebrafish embryos were injected with 15 ng of either a control MO or MoZFSNW1 and fixed at 13 hpf for WISH using a probe against the neural crest marker Sox10, or at 12 hpf for WISH with probes against FoxD3 and the adaxial and paraxial mesoderm marker MyoD. A group of embryos is shown, as well as a representative single embryo. The neural crest cells are marked by grey arrowheads, and the MyoD-postive cells by an asterisk (righthand panels). For the MyoD staining, only the adaxial mesoderm is visible, and this is not affected by SNW1 depletion. In all cases the number of embryos out of the total analyzed that showed the presented staining pattern or phenotype is given.