
Fig. 3
- ID
- ZDB-IMAGE-110221-12
- Publication
- Li et al., 2011 - Rack1 is required for Vangl2 membrane localization and planar cell polarity signaling while attenuating canonical Wnt activity
- All Figures
- Figures for Li et al., 2011
|
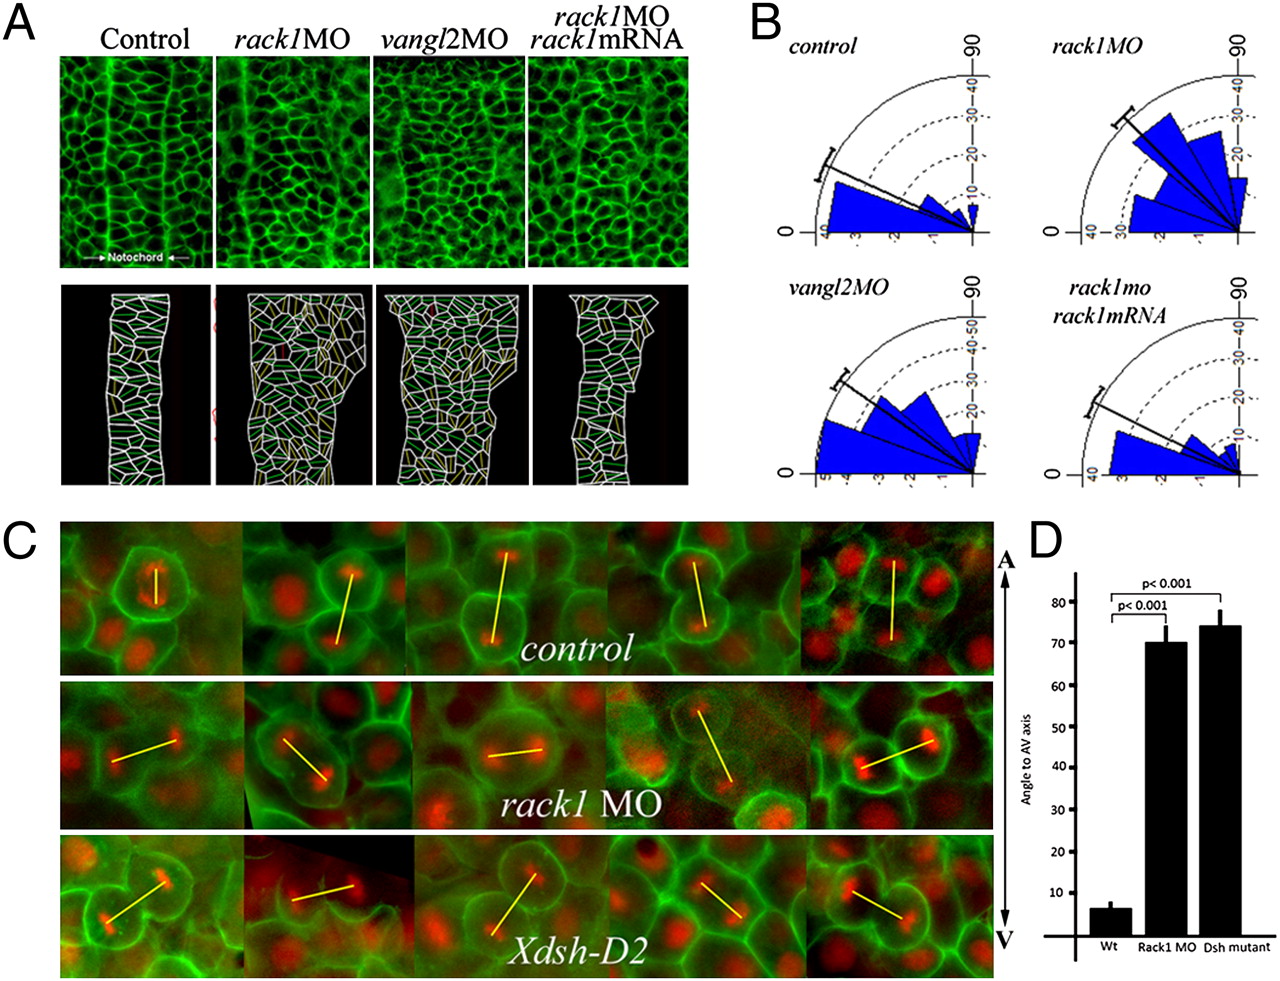
Fig. 3 Cellular polarization and oriented cell division are disrupted in rack1 morphants. (A and B) Cellular morphology in the notochord at the bud stage was visualized with fluorescein-labeled BODIPY ceramide (A Upper) and diagramed (A Lower). The angles formed between the long axis of each cell and the mediolateral axis of each embryo were calculated and plotted with the Oriana 3 program (B). (C and D) Embryos injected with control or rack1 MOs, or RNAs encoding Xdsh-D2, Histone 2B-RFP, and membrane GFP were imaged at the shield stage from the dorsal side to visualize the orientation of mitotic divisions in dorsal epiblast cells (C). The angles formed between the direction of each mitotic spindle and the animal–vegetal axis of each embryo were quantified (D). The yellow lines depict the orientation of mitotic spindles. A-V, animal–vegetal axis.