
IMAGE
Fig. S4
- ID
- ZDB-IMAGE-110214-74
- Publication
- Ohata et al., 2011 - Dual Roles of Notch in Regulation of Apically Restricted Mitosis and Apicobasal Polarity of Neuroepithelial Cells
- All Figures
- Figures for Ohata et al., 2011
Image
|
Figure Caption
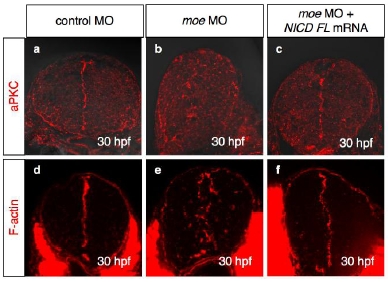
Fig. S4 Visualization of aPKC (a-c; red) and F-actin (d-f; red) in the WT embryos injected with control MO (a,d; 2.0 mg/ml), moe MO (b,e; 2.0 mg/ml), and moe MO plus NICD FL mRNA (c,f; 2.0 mg/ml and 60 ng/ml, respectively) at 30 hpf. Cross-sectional views, dorsal to the top.
Acknowledgments
This image is the copyrighted work of the attributed author or publisher, and
ZFIN has permission only to display this image to its users.
Additional permissions should be obtained from the applicable author or publisher of the image.
Full text @ Neuron