
Fig. S2
- ID
- ZDB-IMAGE-110214-72
- Publication
- Ohata et al., 2011 - Dual Roles of Notch in Regulation of Apically Restricted Mitosis and Apicobasal Polarity of Neuroepithelial Cells
- All Figures
- Figures for Ohata et al., 2011
|
Fig. S2
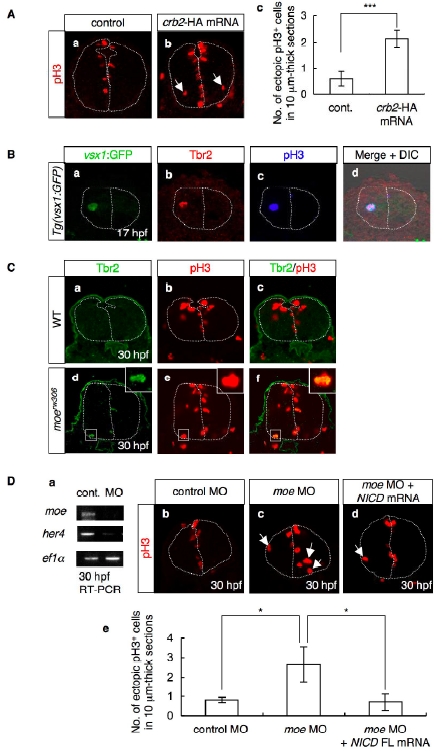
(A) Mitotic cells visualized by staining with anti-pH3 antibody (red) of the control (a) and Crb2-HA-overexpressing (b) embryos at 30 hpf. Cross-sectional views, dorsal to the top. Arrows indicate mitotic cells that are proliferating away from the ventricular zone. The dotted lines indicate the outlines of the neural tubes and the midlines. (c) The number of ectopically dividing cells was assessed in 10-μm-thick sections. Data shown are mean ± SEM; ***, P < 0.005.
(B) Immunohistochemical detection of Tbr2 (b; red) and pH3 (c; blue) in the Tg(vsx1:GFP) transgenic zebrafish embryos at 17 hpf. vsx1:GFP is shown in green (a). Merged images of the signals associated with vsx1:GFP, Tbr2, and pH3 are shown in (d) together with differential interference contrast (DIC). The dotted lines indicate the outlines of the neural tubes and the midlines. Cross-sectional views, dorsal to the top.
(C) Immunohistochemical detection of Tbr2 (a,d; green) and pH3 (b,e; red) in the WT (a-c) and moerw306 mutant (d-f) embryos at 30 hpf. Merged images of the signals associated with Tbr2 and pH3 are shown in (c,f). The dotted lines indicate the outlines of the neural tubes and the midlines. Cross-sectional views, dorsal to the top. Note that Tbr2 was detected using an antibody raised against N-terminus of zebrafish Tbr2a (N. Miyasaka and Y. Yoshihara, RIKEN BSI, unpublished), while data in Figure 4C were taken using an antibody raised against C-terminus of mouse Tbr2 (abcam).
(D) (a) The efficiency of the splice-blocking MO against moe mRNA and the expression of Notch downstream gene her4 were examined by RT-PCR at 30 hpf. cDNAs of control morphants (cont.) and moe morphants (MO) were amplified with primers in which the target region of the MO is covered. Therefore, a band is not detected if maturation of moe mRNA is inhibited by the MO. ef1α; loading control. (b-d) Visualization of pH3 (red) in the WT embryos injected with control MO (b, 2.0 mg/ml), moe MO (c, 2.0 mg/ml), and moe MO plus NICD FL mRNA (d, 2.0 mg/ml and 60 ng/ml, respectively) at 30 hpf. The arrows indicate the ectopically mitotic cells. Cross-sectional views, dorsal to the top. (e) The numbers of ectopic mitotic cells in 10-μm-thick sections were quantified. Data shown in are mean ± SEM; *, P < 0.05.