
Fig. 5
- ID
- ZDB-IMAGE-110105-52
- Genes
- Publication
- Oehlers et al., 2011 - A chemical enterocolitis model in zebrafish larvae that is dependent on microbiota and responsive to pharmacological agents
- All Figures
- Figures for Oehlers et al., 2011
|
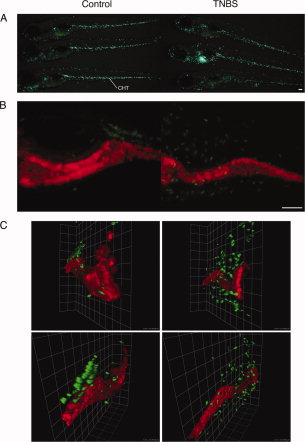
Fig. 5 Zebrafish larvae mount a leukocytic response to trinitrobenzene sulfonic acid (TNBS) exposure. Left column is control and right column is TNBS-exposed. A: Comparison of neutrophil distribution in 6 days postfertilization (dpf) TG(mpx:EGFP)114. Larvae exposed to TNBS demonstrated a redistribution of leukocytes away from the CHT region. B: Comparison of confocal microscopy images of double transgenic TG(mpx:EGFP114, ifabp:RFP) larvae expressing EGFP in neutrophils and RFP in intestinal epithelial cells. C: Three-dimensional reconstruction of confocal microscopy data illustrating two angles. Scale bars in A and B represent 100 μm. CHT, caudal hematopoietic tissue. EGFP, enhanced green fluorescent protein. RFP, red fluorescent protein.