
|
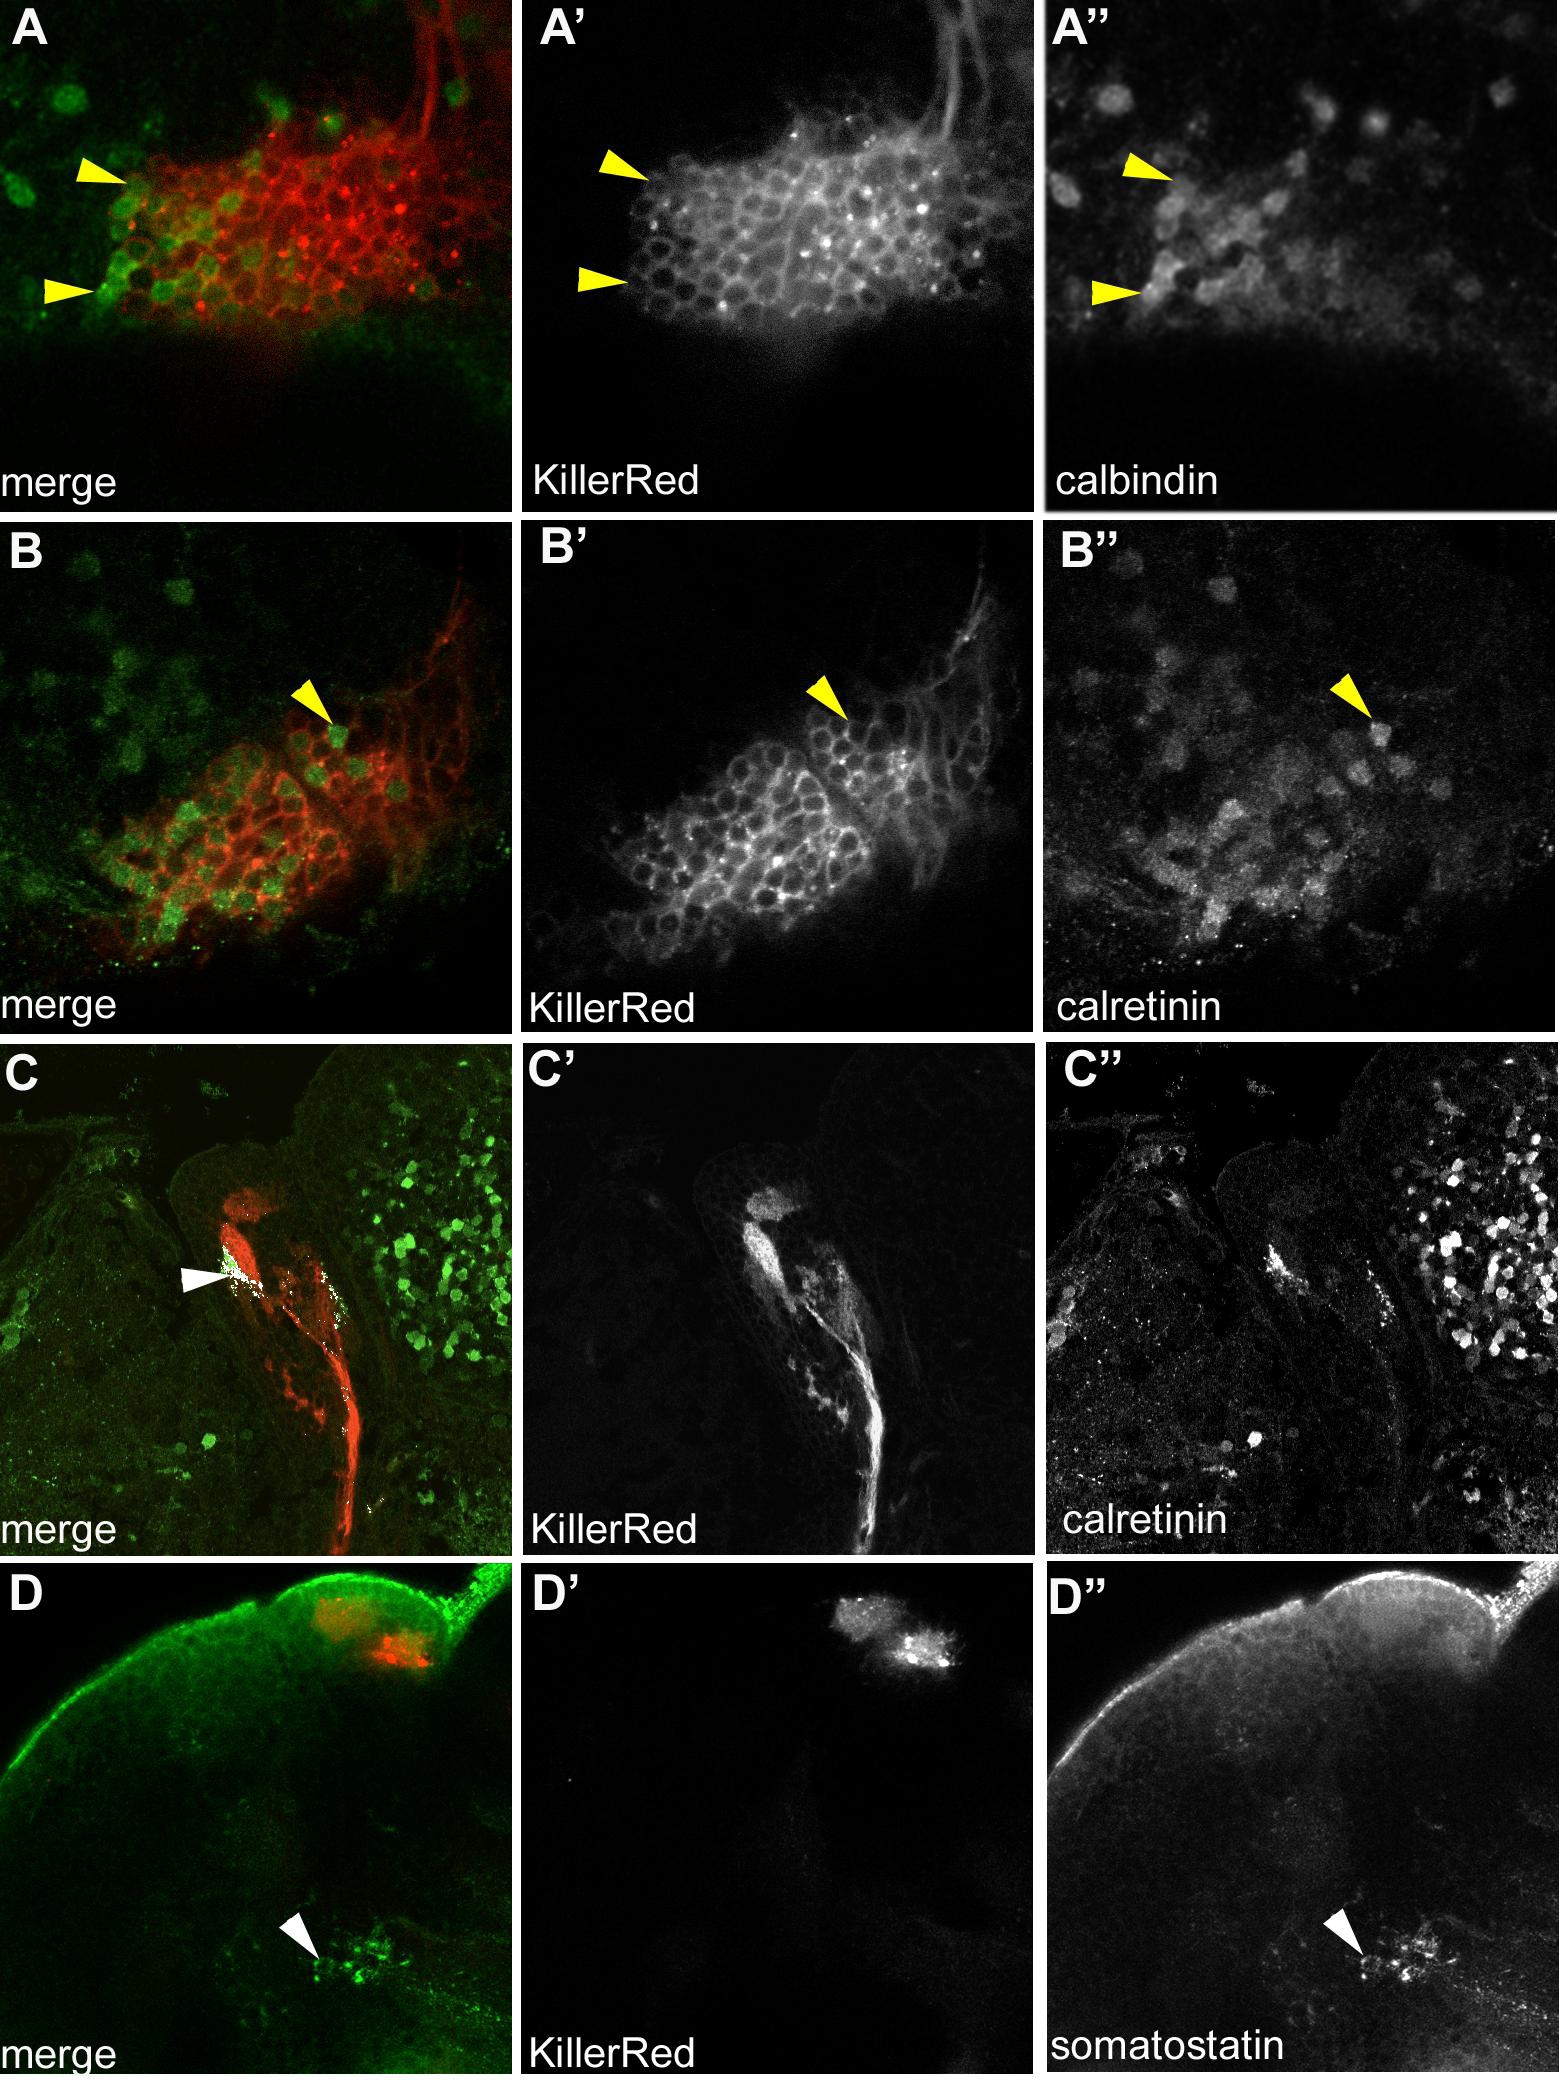
Fig. S1 Related to Figure 2. Characterization of Habenula Afferents Expressing KillerRed in KR11
(A) Calbindin and KillerRed in a single optical section of the sample shown in Fig. 2D. Yellow arrowheads indicate cells expressing both calbindin and KillerRed.
(B) An optical section of a 3-week old fish, after labeling with an antibody to calretinin (green). Calretinin is visible in KillerRed expressing cells (yellow arrowhead).
(C) A sagittal section of a 4-week old fish. Colocalization of calretinin and KillerRed, as analyzed using the colocalization highlighter in imageJ, is indicated in white (arrowhead).
(D) A single optical section, lateral view, showing somatostatin in cells that are located medial to the KillerRed expressing cluster.
Anterior is to the left in all images.