
Fig. 8
- ID
- ZDB-IMAGE-101118-34
- Antibodies
- Publication
- Song et al., 2010 - Neural and Synaptic Defects in slytherin, a Zebrafish Model for Human Congenital Disorders of Glycosylation
- All Figures
- Figures for Song et al., 2010
|
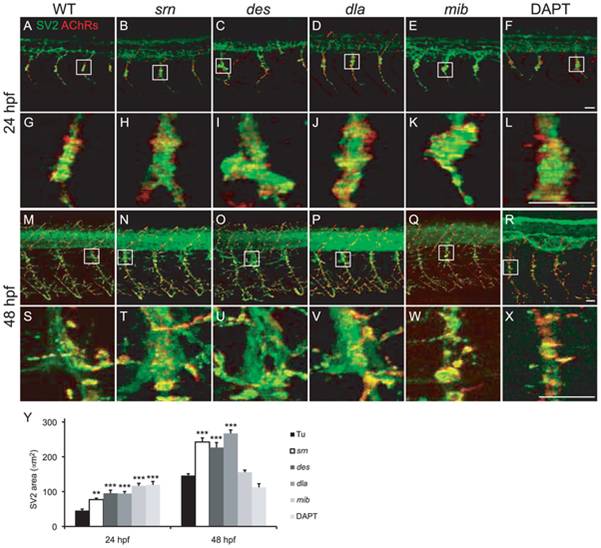
Fig. 8 A–X. Presynaptic terminals (green) and postsynaptic AChR clusters (red) in 24 and 48 embryos from WT (A, G, M, S), srn (B, H, N, T), des (C, I, O, U), dla (D, J, P, V), mib (E, K, Q, W) and DAPT treated embryos (F, L, R, X). Boxed regions are shown at higher magnification at 24 (G–L) and 48 hpf (S–X; 3 hemisegments in each of 20 embryos, 3 carrier pairs for each). Scale bar = 20 μm. Y. Presynaptic terminal, axon and synapse area at the choice point was significantly increased in all mutants, except in mib and DAPT treated embryos at 48 hpf, compared to WT (one-way ANOVA, Bonferroni′s Multiple Comparison Test, ** p<0.01, *** p<0.001).