
|
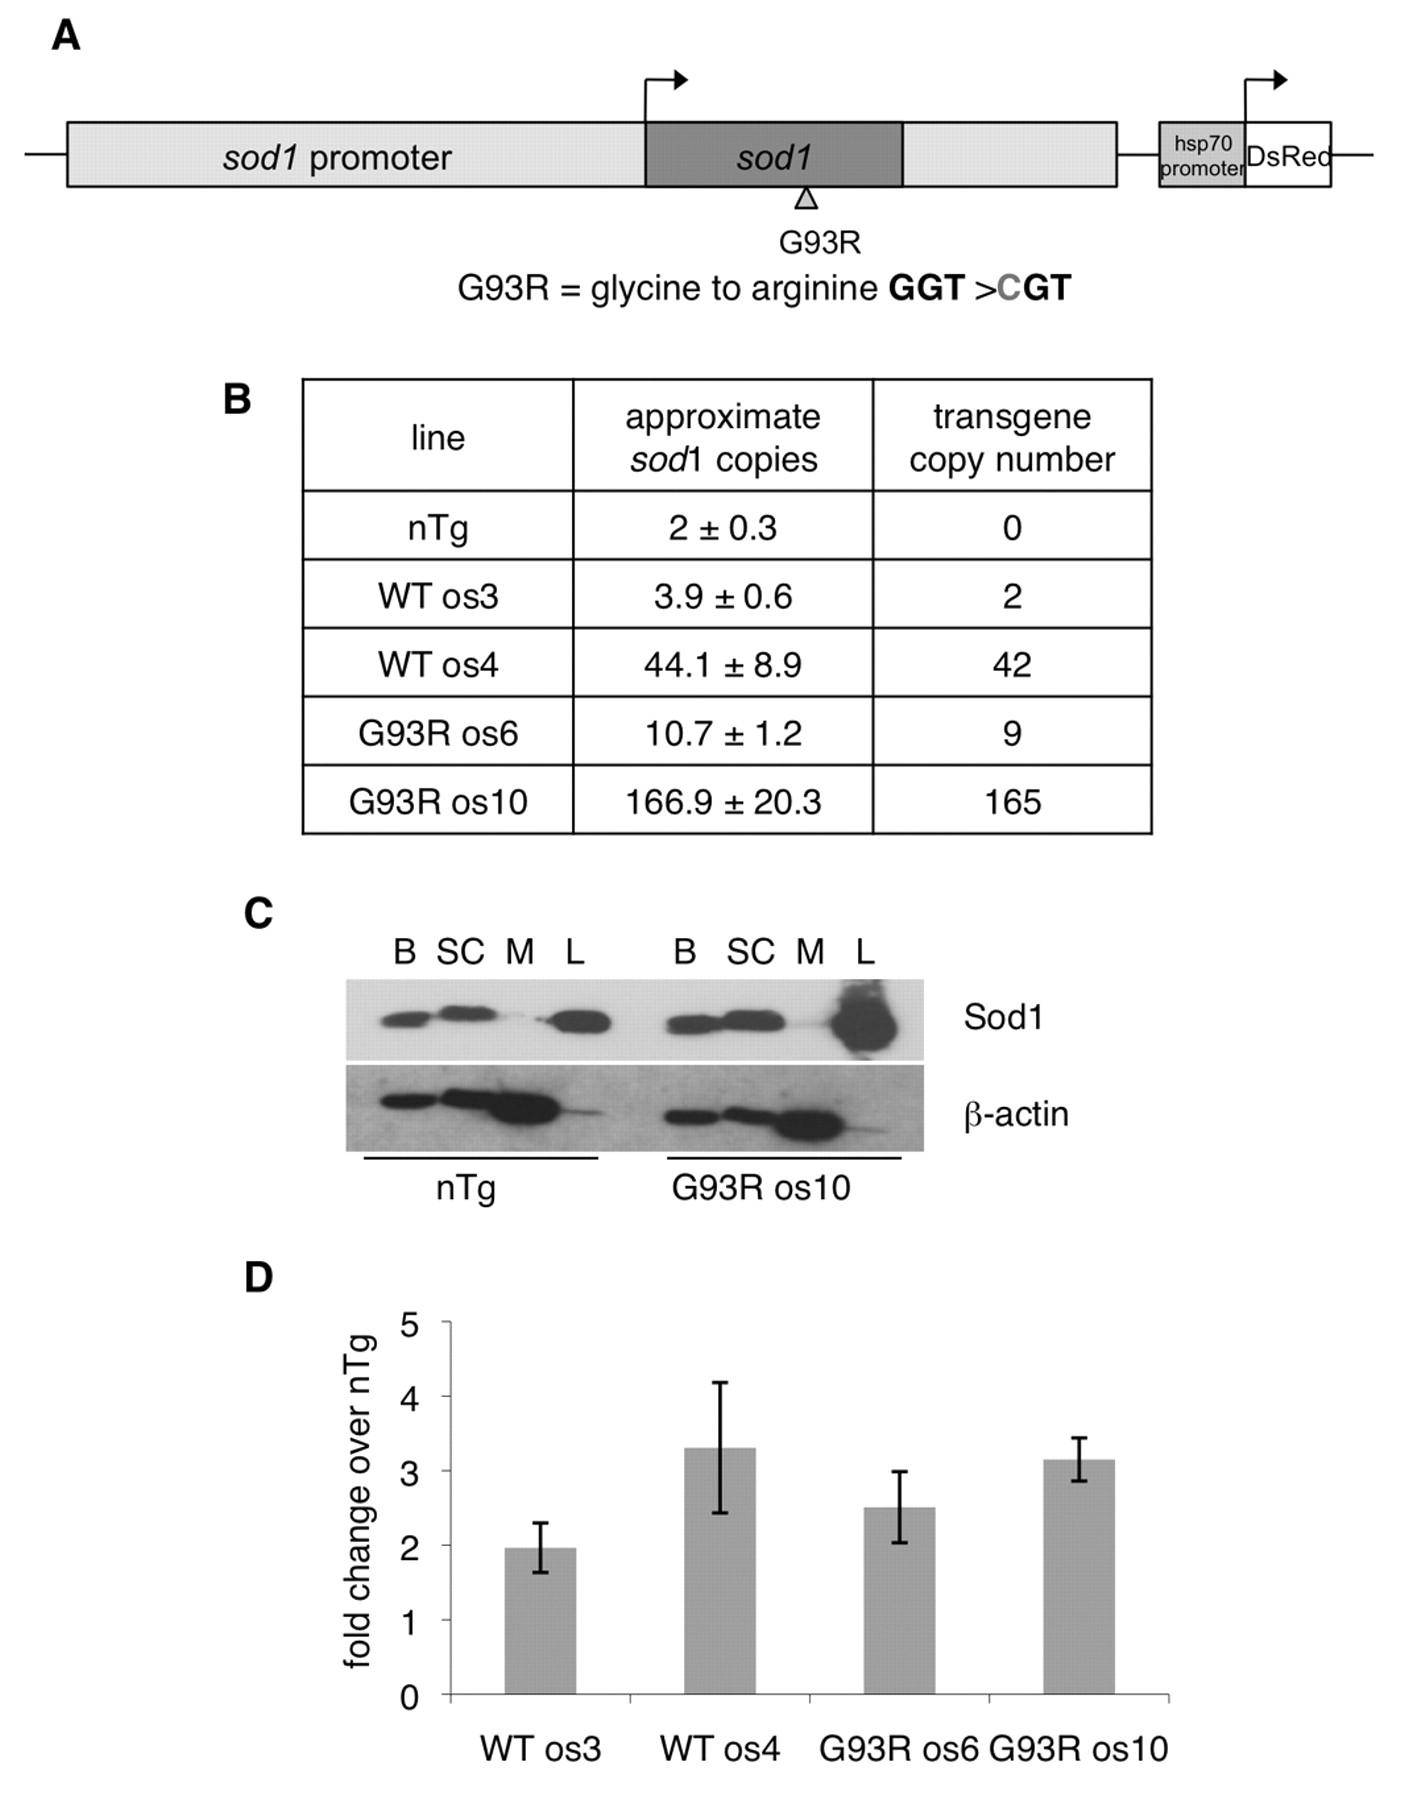
Fig. 1 Generation of zebrafish transgenics that overexpress wild-type and mutant Sod1. (A) BAC recombineering was utilized to generate the transgenic construct from the zebrafish sod1 gene and surrounding regulatory sequences. The hsp70 promoter was utilized to drive the fluorescent protein DsRed to track transgenesis. (B) Transgene copy number was approximated by quantitative PCR (n=6 per line). (C) Western blots for Sod1 and β-actin with 10 μg of protein from various tissues from G93R os10 and non-transgenic clutch-mate controls (nTg). B, brain; SC, spinal cord; M, muscle; L, liver. (D) Fold change of Sod1 steady-state protein levels in brain homogenates from transgenic lines over nTg control fish. A total of three to six separate samples were quantitated for each line from fish that were 12±2 months of age. Sod1 levels were determined by densitometry and normalized to β-actin. Data are mean ± s.e.m.