
Image
|
Figure Caption
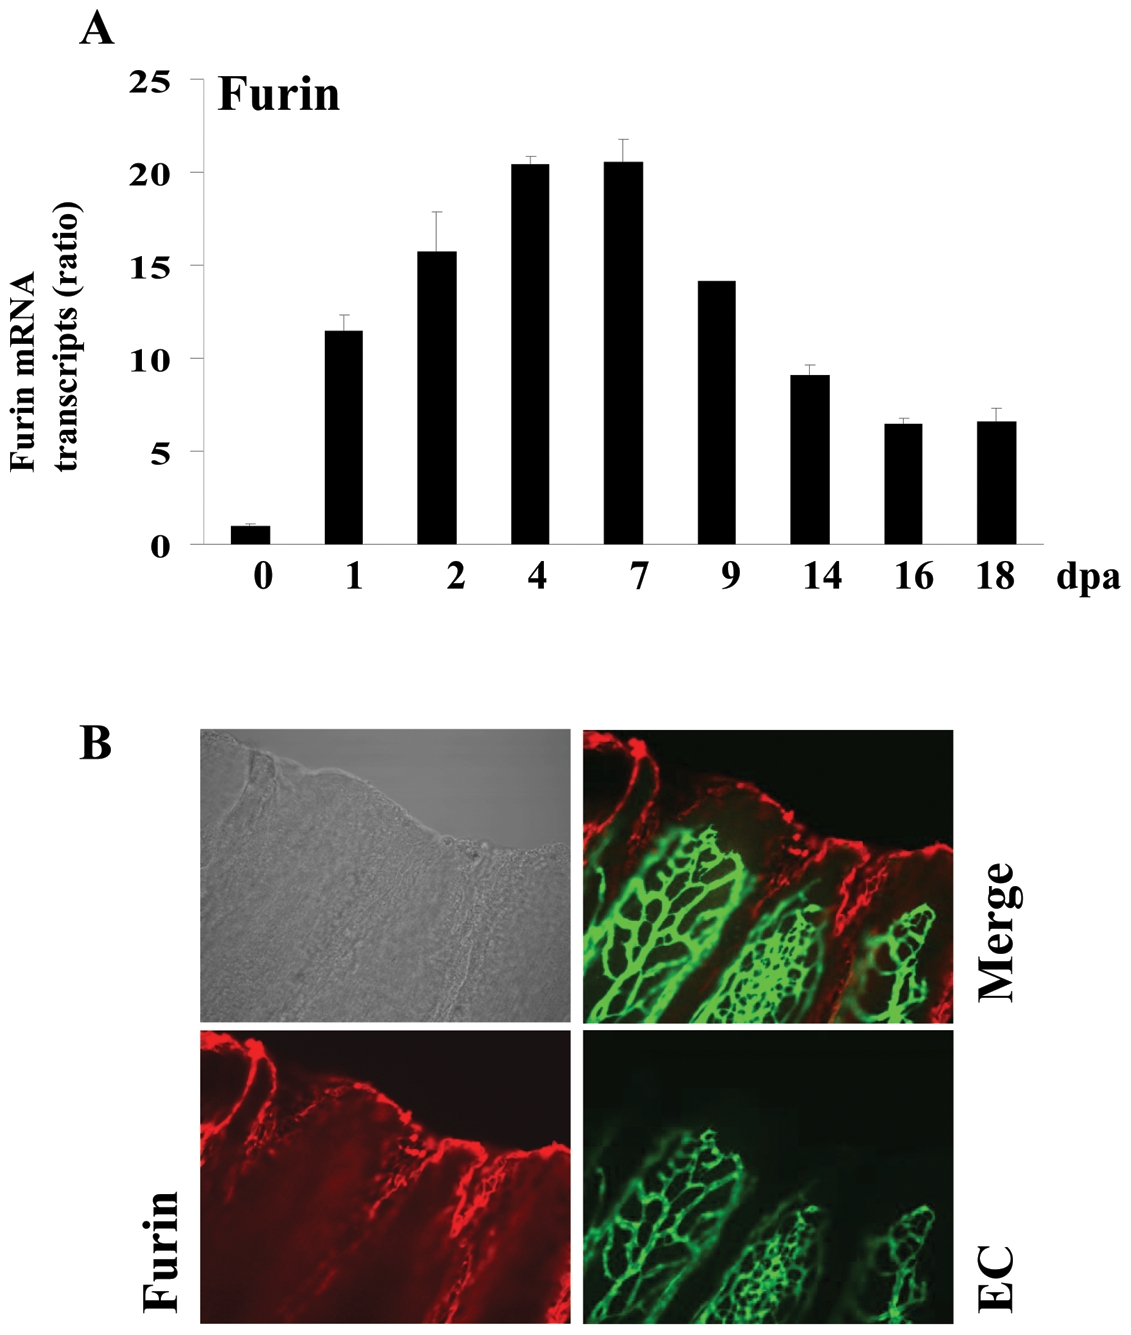
Fig. 6 Expression of Furin during fin regeneration.
(A) Total RNA was isolated from fins (15–20 fins per time point) and analyzed by real-time PCR using specific primers for zebrafish Furin or β-actin. Results are shown in the bar graph and are expressed as the ratio of the indicated transcripts relative to control (0 dpa). Results are shown as means ± S.E. of three experiments performed in triplicate. (B) Immunofluorescence analysis revealed that Furin is mainly localized to the apical growth zone of the regenerating fin (red signal, 25x objective).
Figure Data
Acknowledgments
This image is the copyrighted work of the attributed author or publisher, and
ZFIN has permission only to display this image to its users.
Additional permissions should be obtained from the applicable author or publisher of the image.
Full text @ PLoS One