
Image
|
Figure Caption
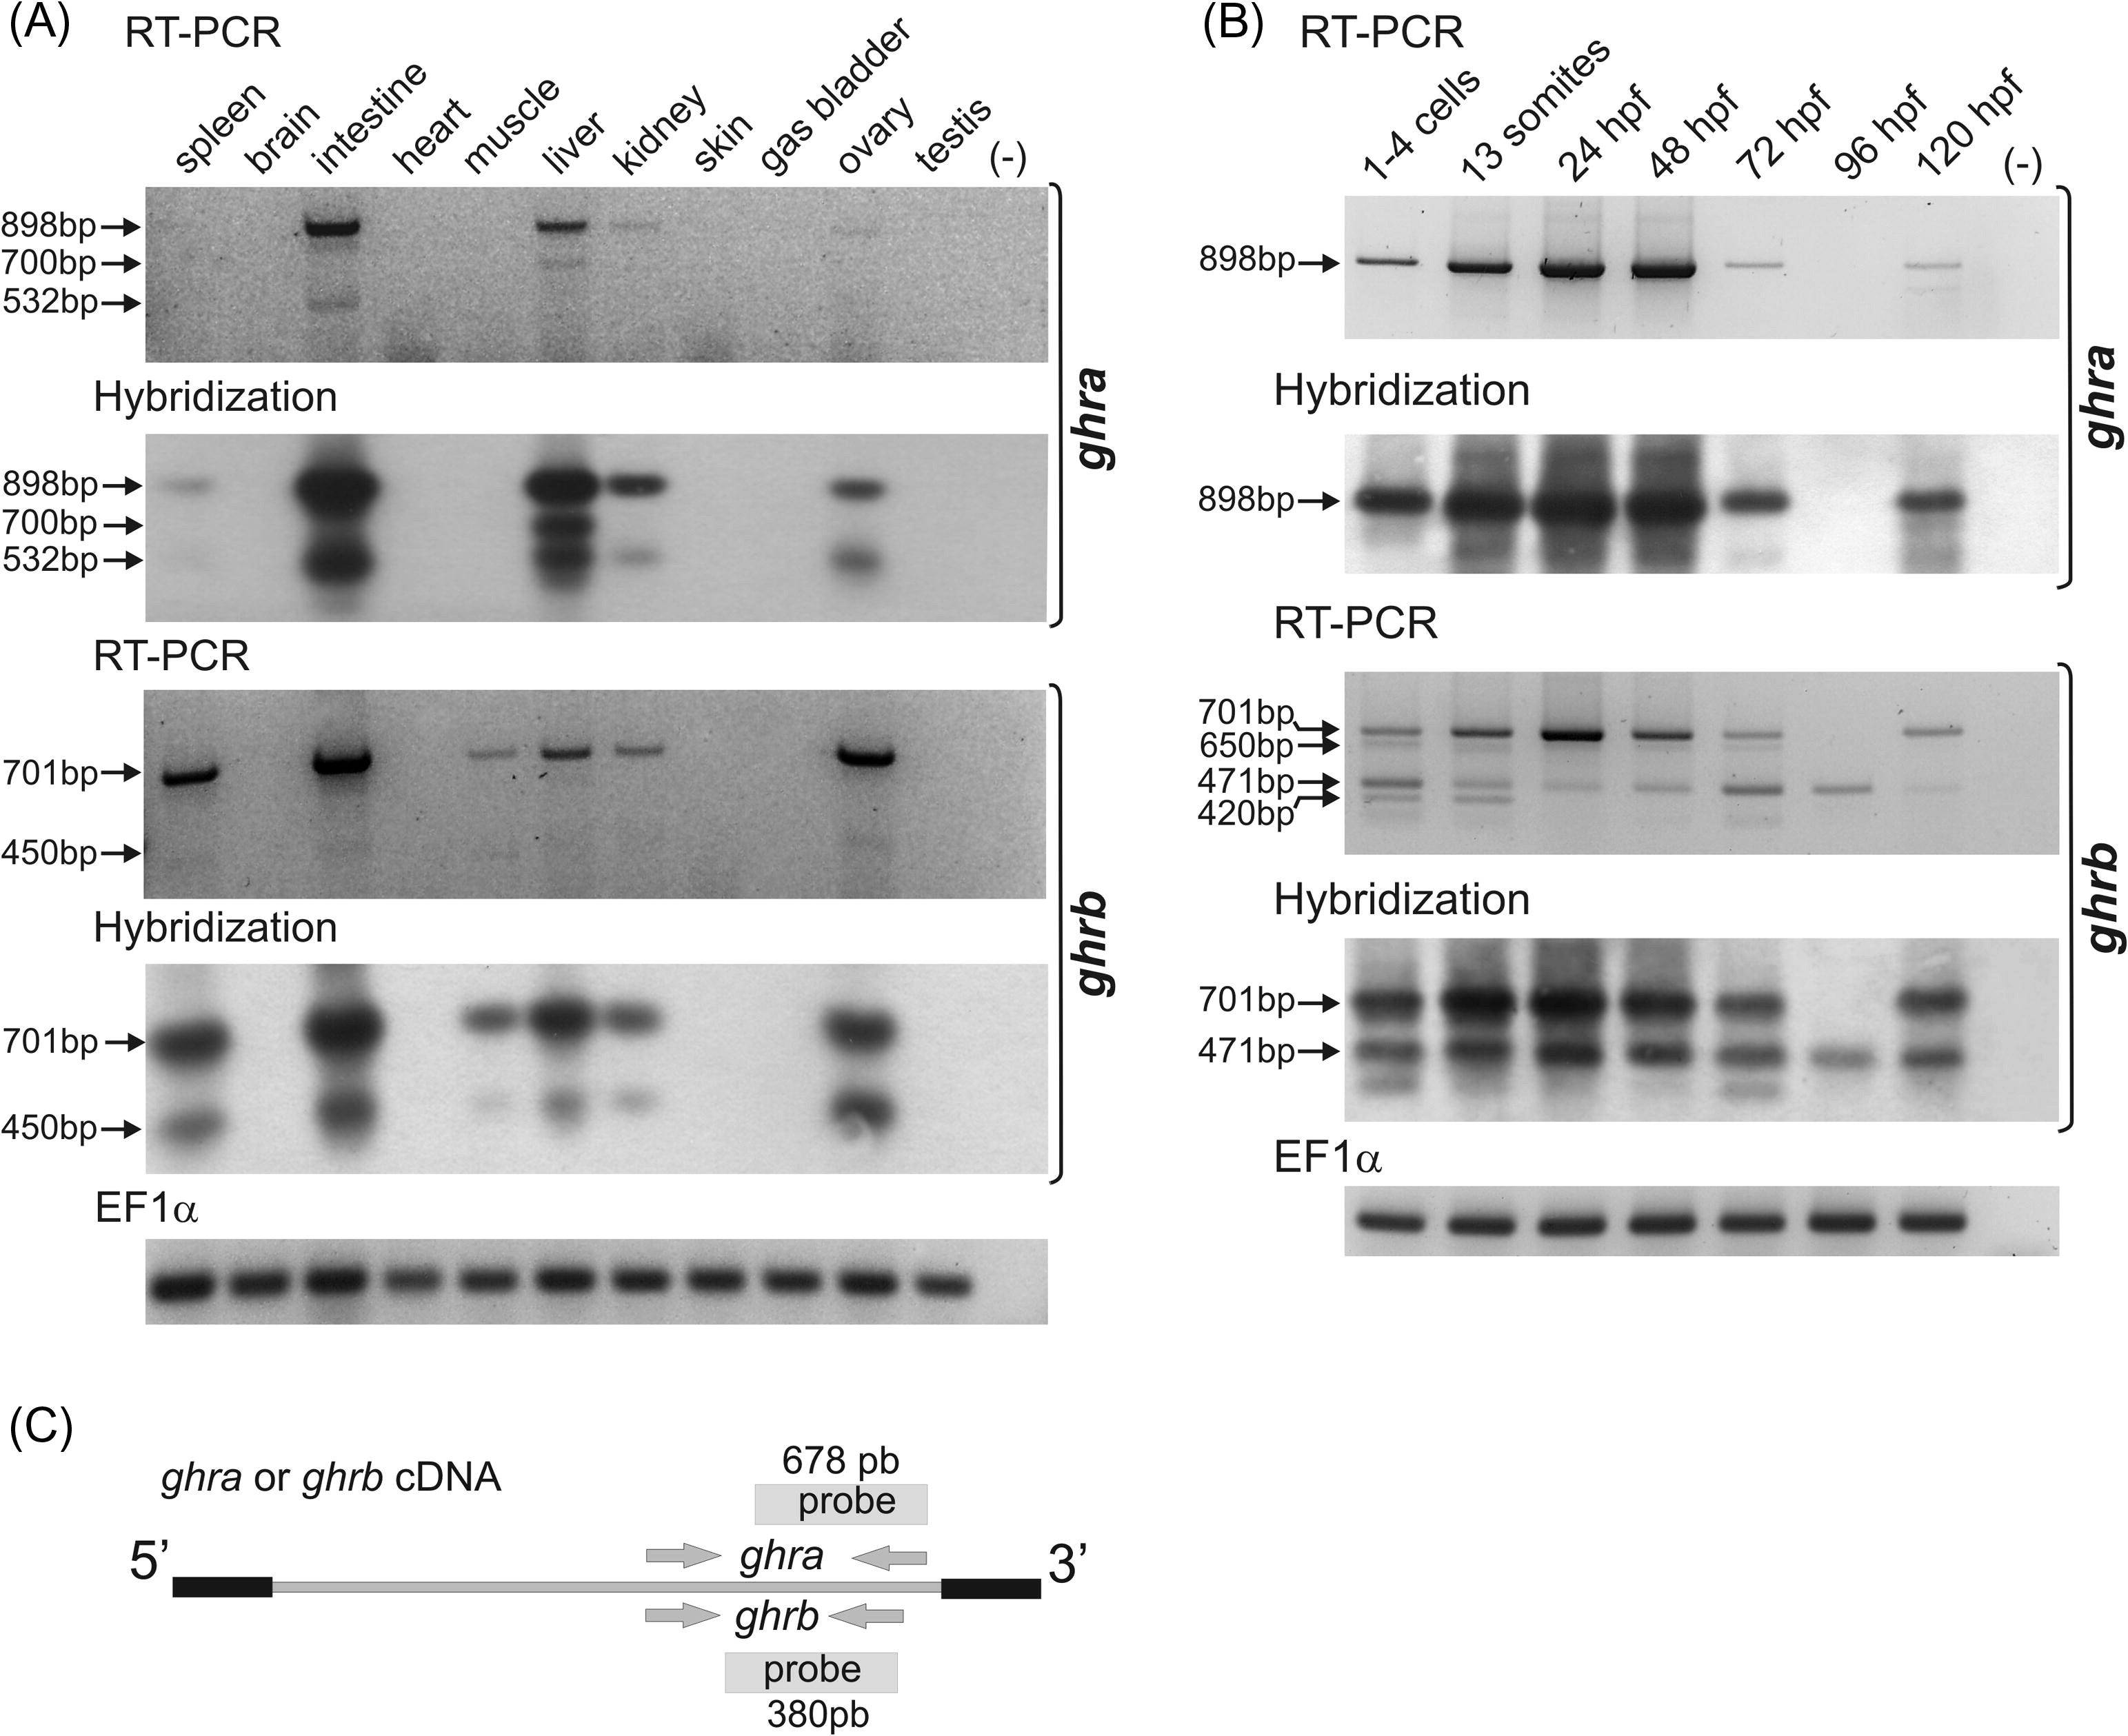
Fig. 5 Expression patterns of zebrafish ghra and ghrb in adult tissues (A) and during embryonic development (B), studied by RT-PCR and Southern blotting. EF1α transcripts were amplified as control. PCR with no template were carried out as negative controls (-). The full-length (expected) and the shorter amplicons are indicated by arrows (A and B). Sizes of the amplicons are: 898, 532, and 700 bp for ghra and 701, 420, 471 and 650 bp for ghrb. (C) Positions of primer pairs used in RT-PCR and probes used in Southern blotting for ghra and ghrb cDNAs.
Figure Data
Acknowledgments
This image is the copyrighted work of the attributed author or publisher, and
ZFIN has permission only to display this image to its users.
Additional permissions should be obtained from the applicable author or publisher of the image.
Reprinted from Gene expression patterns : GEP, 10(4-5), Di Prinzio, C.M., Botta, P.E., Barriga, E.H., Ríos, E.A., Reyes, A.E., and Arranz, S.E., Growth hormone receptors in zebrafish (Danio rerio): adult and embryonic expression patterns, 214-225, Copyright (2010) with permission from Elsevier. Full text @ Gene Expr. Patterns