
IMAGE
Fig. 5
- ID
- ZDB-IMAGE-100616-117
- Publication
- Yao et al., 2010 - Atoh8, a bHLH transcription factor, is required for the development of retina and skeletal muscle in zebrafish
- All Figures
- Figures for Yao et al., 2010
Image
|
Figure Caption
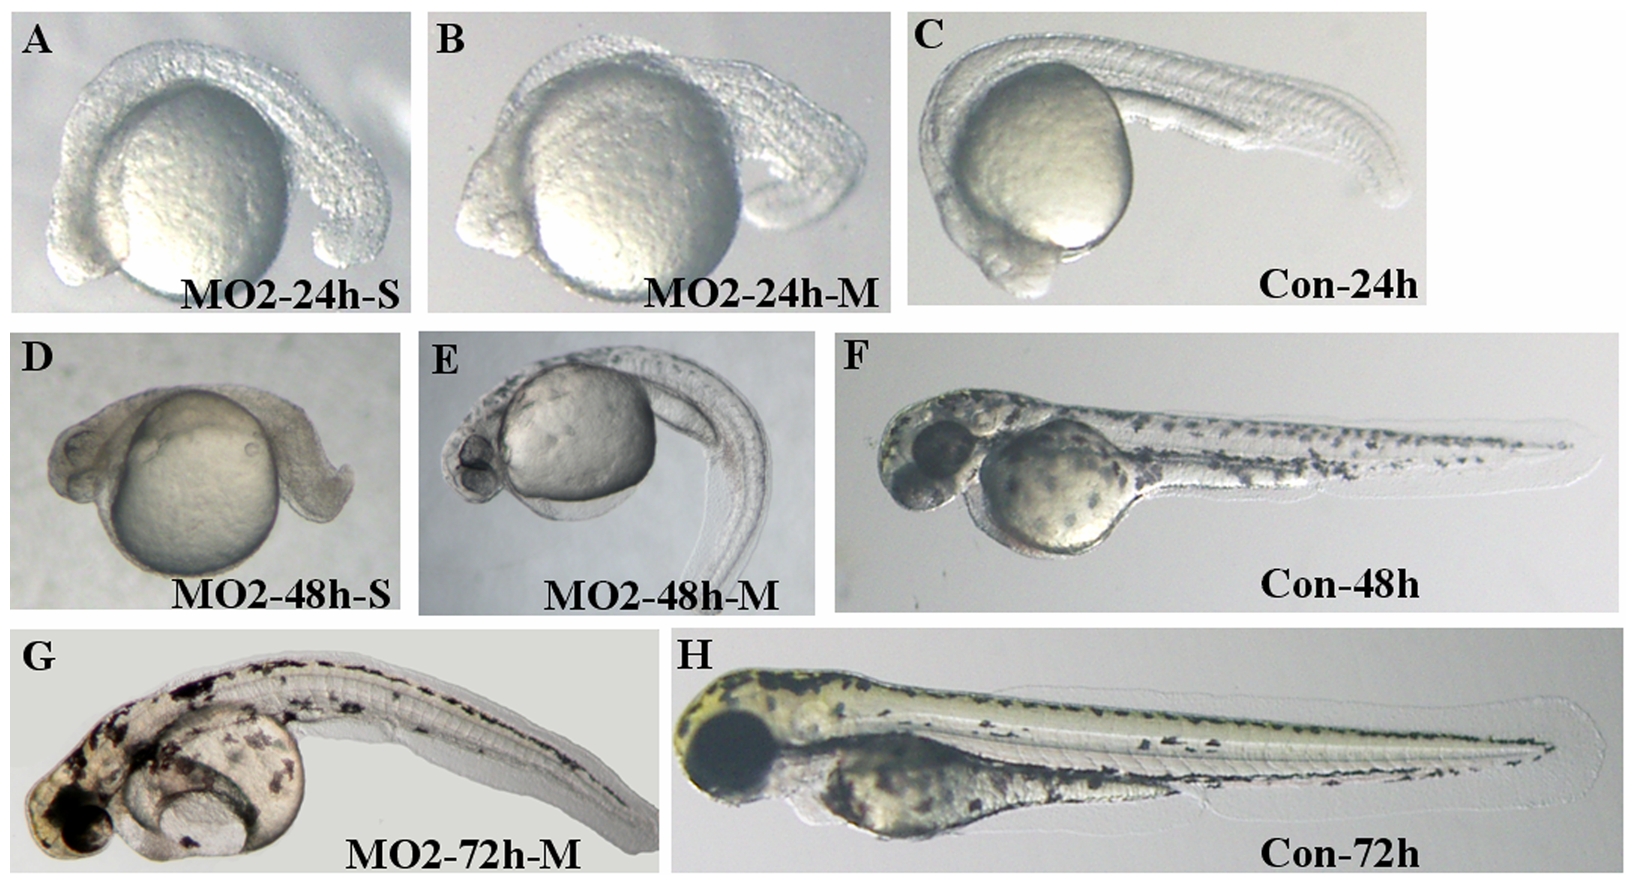
Fig. 5 Phenotypes of splicing blocking morpholino (MO2) knockdown embryos.
(A–C) 24 hpf. (D–F) 48 hpf. (G–H) 72 hpf. A–B, D–E and G are MO2 treated embryos: A and D, severe abnormality, B, E and G, mild abnormality and C, F and H, control-MO treated embryos. The figure shows that splicing blocking morpholino treated embryos show similar phenotypes as that of translation blocking MO1-treated ones.
Figure Data
Acknowledgments
This image is the copyrighted work of the attributed author or publisher, and
ZFIN has permission only to display this image to its users.
Additional permissions should be obtained from the applicable author or publisher of the image.
Full text @ PLoS One