
Image
|
Figure Caption
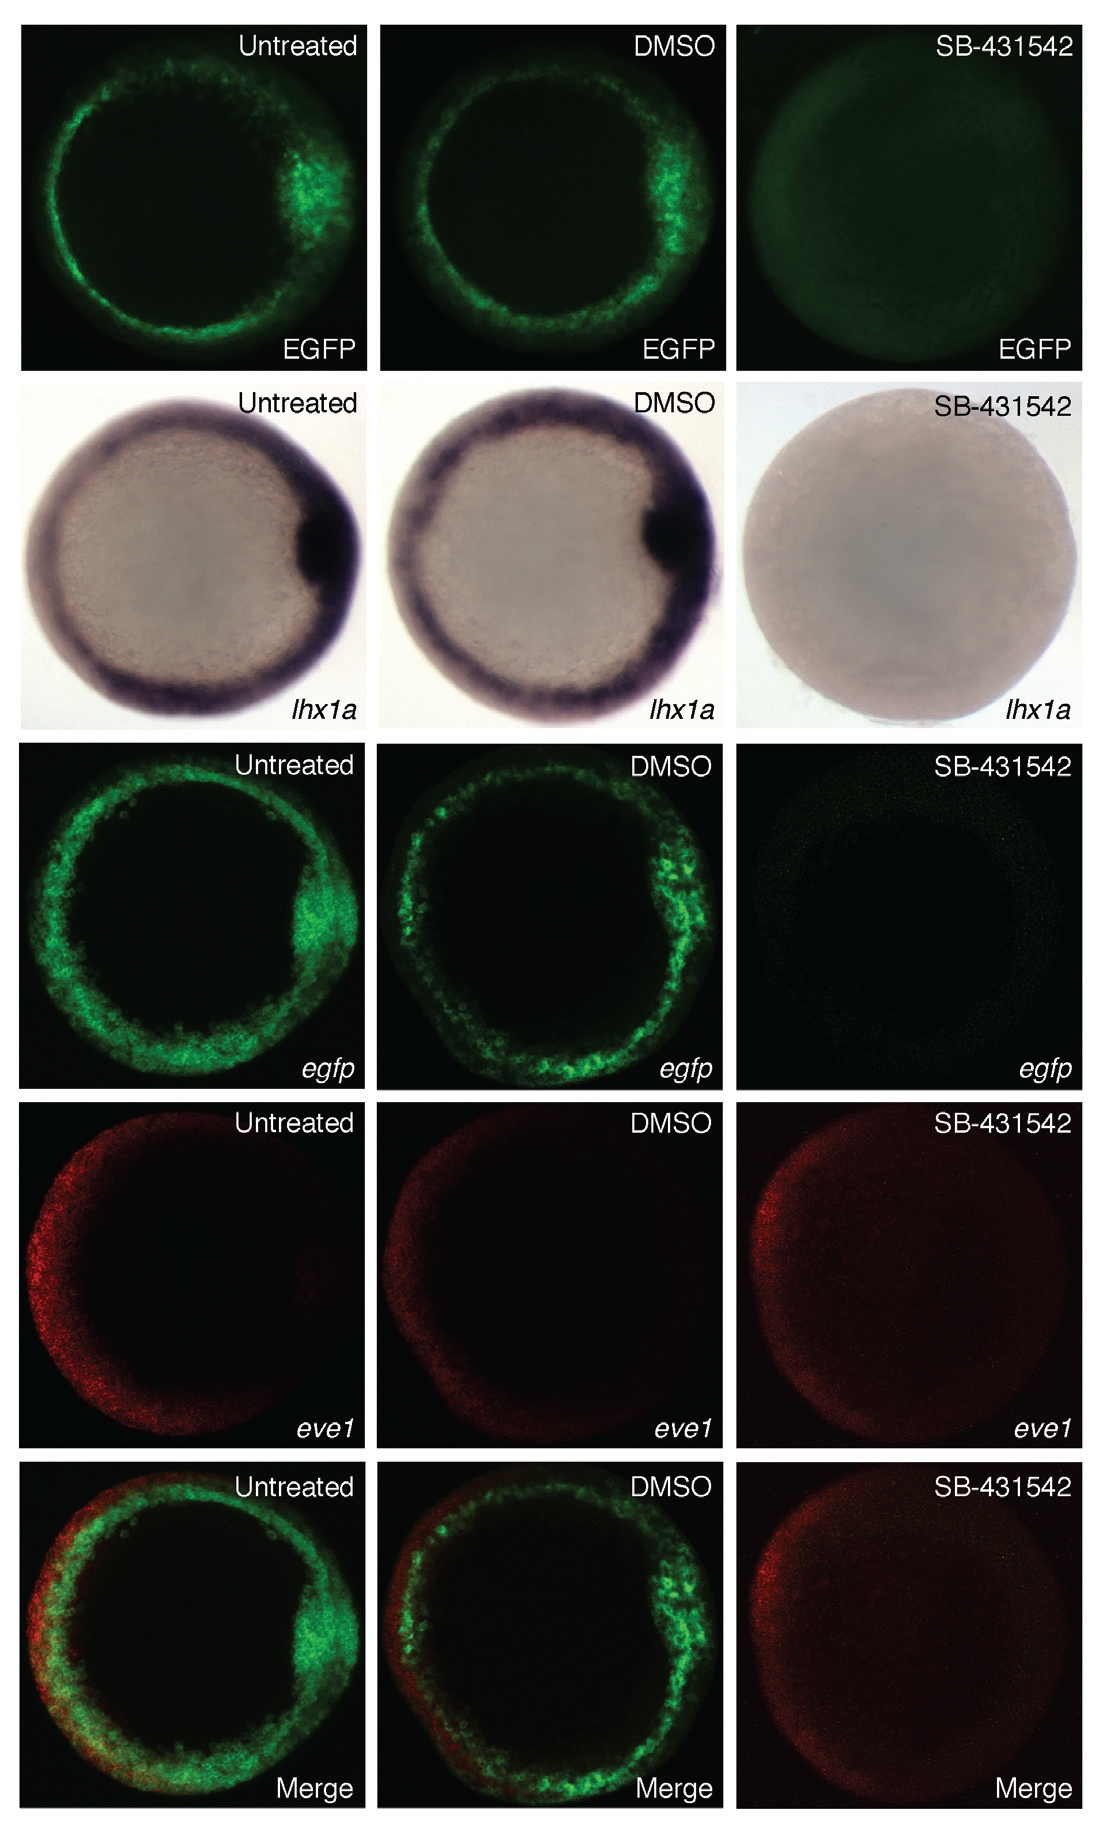
Fig. 4
Modulation of Tg(lhx1a:EGFP)pt303 expression by SB-431542.
(A-O) Shield stage Tg(lhx1a:EGFP)pt303 embryos, animal view. (A,D,G,J,M) Untreated control embryos. (B,E,H,K,N) Embryos treated with 0.8% DMSO. (C,F,I,L,O) Embryos treated with 800 μM SB-431542. (A-C) Tg(lhx1a:EGFP)pt303 expression. (D-F) In situ hybridization for lhx1a. (G-O) Fluorescent in situ hybridization. (G-I) egfp. (J-L) eve1. (M-O) Merged images.
Figure Data
Acknowledgments
This image is the copyrighted work of the attributed author or publisher, and
ZFIN has permission only to display this image to its users.
Additional permissions should be obtained from the applicable author or publisher of the image.
Full text @ Int. J. Dev. Biol.