
Fig. 3
- ID
- ZDB-IMAGE-100309-47
- Genes
- Publication
- Poon et al., 2010 - Zebrafish cardiac enhancer trap lines: New tools for in vivo studies of cardiovascular development and disease
- All Figures
- Figures for Poon et al., 2010
|
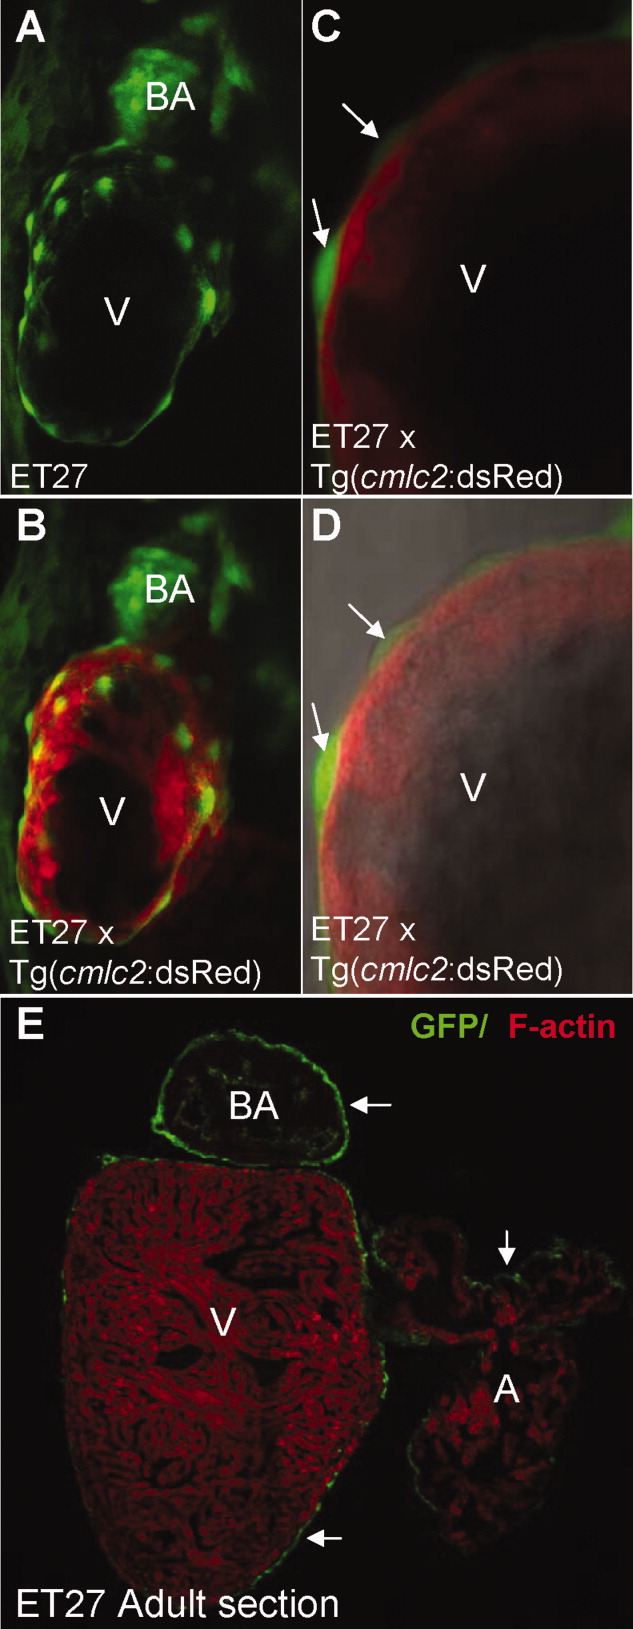
Fig. 3 CETs that define the epicardium in vivo. A, B: ET27 with EGFP-positive cells covering the ventricle; note that EGFP expression in the BA precedes that in the epicardium; C, D: The EGFP-positive epicardial cells (arrow) enveloping the internal cmlc2 highlighted myocardium at high magnification. E: Cross-section of the adult ET27 heart at low magnification, with GFP-labelled epicardium on the external surface of the BA, atrium and ventricle (arrow). B-D: Double transgenic embryos of ET27 and Tg(cmlc2:dsRed). All except D are fluorescent images. D: Composite fluorescent/DIC images. A, atrium; BA, bulbus arteriosus; V, ventricle.