
Fig. 2
- ID
- ZDB-IMAGE-100211-33
- Genes
- Publication
- Rikin et al., 2010 - The tbx/bHLH transcription factor mga regulates gata4 and organogenesis
- All Figures
- Figures for Rikin et al., 2010
|
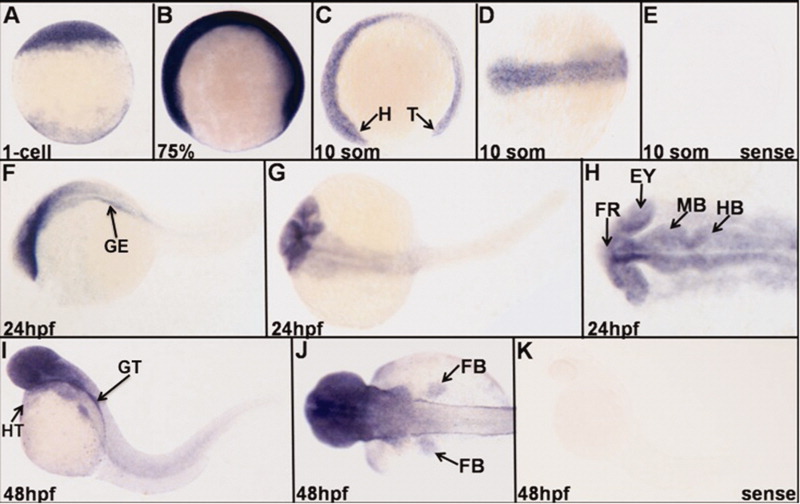
Fig. 2 Zebrafish mga transcripts are expressed maternally and throughout embryogenesis, with eventual restriction to anterior regions. Shown are representative embryos following in-situ hybridization using probes specific to mga, or as indicated using a control sense strand probe. A: Maternal expression at the 1-cell stage. B: During late gastrulation, transcripts are widely expressed at relatively high levels, except in the yolk syncytial layer, shown here at 75% epiboly. C-E: There is fairly ubiquitous expression during somitogenesis stages (10 somite stage) shown in a (C) lateral view or a (D) dorsal view. E: A control sense probe at the 10 somite stage. F-H: mga transcripts become restricted by 24 hpf to the anterior region including head/brain, heart, and gut endoderm (arrow in F) as shown in a lateral view (F) or dorsal views (G, H) where H shows a representative flat-mounted embryo. I-K: mga transcripts are enriched at 48 hpf in the head/brain, gut tube (arrow in I), and fin buds as shown either in (I) a lateral view or (J) a dorsal view. K: A representative embryo hybridized with the control sense probe at 48 hpf. In all cases, anterior is to the left. H, head; T, tail; HT, heart; FR, forebrain; MB, midbrain; HB, hindbrain; EY, eye; FB, fin bud; GE, gut endoderm; GT, gut tube.