
|
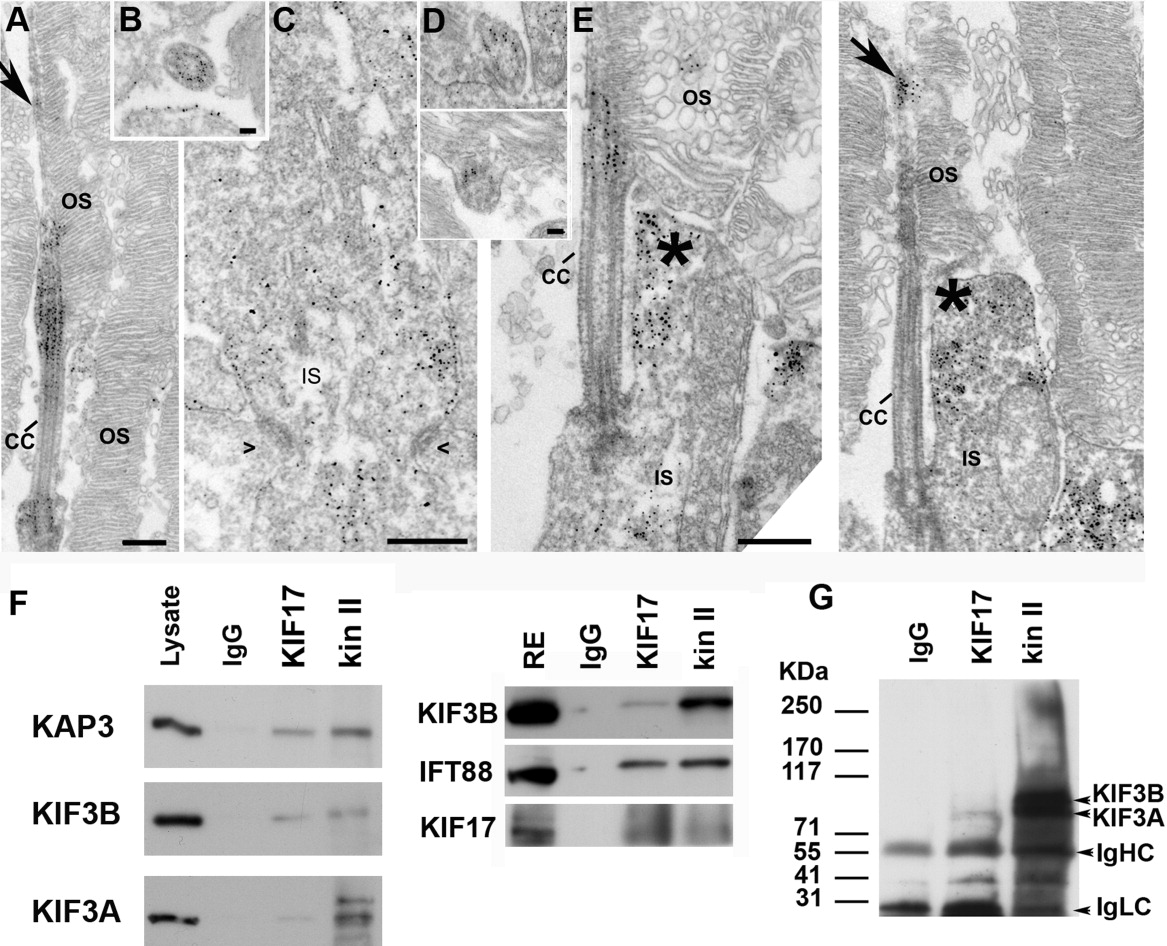
Fig. 1 KIF17 and kinesin II localization and co-immunoprecipitation. A-C: Immuno-electron microscopy (EM) localization of the KAP3 subunit of kinesin II in mouse rod photoreceptor cells. A: Longitudinal section through the connecting cilium and parts of the outer segment (OS). B: Cross-section through the connecting cilium (CC). C: Section through in the endoplasmic reticululm (ER) -Golgi region of the IS. Symbols (><) indicate position of adherens junctions at the outer limiting membrane. D,E: Immuno-EM localization of KIF17. D: Two slightly oblique sections through the CC. E: Two longitudinal images through the photoreceptor at the level of the CC. Arrow points to labeling in the axoneme of the OS. Asterisks indicate labeling in the collar-like extension of the apical IS. F: Co-immunoprecipitation from mouse retinal extracts of either kinesin II or KIF17 with IFT88. IP antibodies are shown at the top. Western blots were done with antibodies for KIF17, IFT88, and the three kinesin II subunits (KAP3, KIF3B, and KIF3A); antibodies are shown on the left. A mixture of IgGs was used as control for nonspecific binding. G: IP experiment as in F from zebrafish retinal extract; the kinesin II antibody (K2.4) recognizes both KIF3A and KIF3B. Scale bars = 400 nm in A, 50 nm in B, 400 nm in C, 50 nm in D (upper), 100 nm in D (lower), 400 nm in E.