
Image
|
Figure Caption
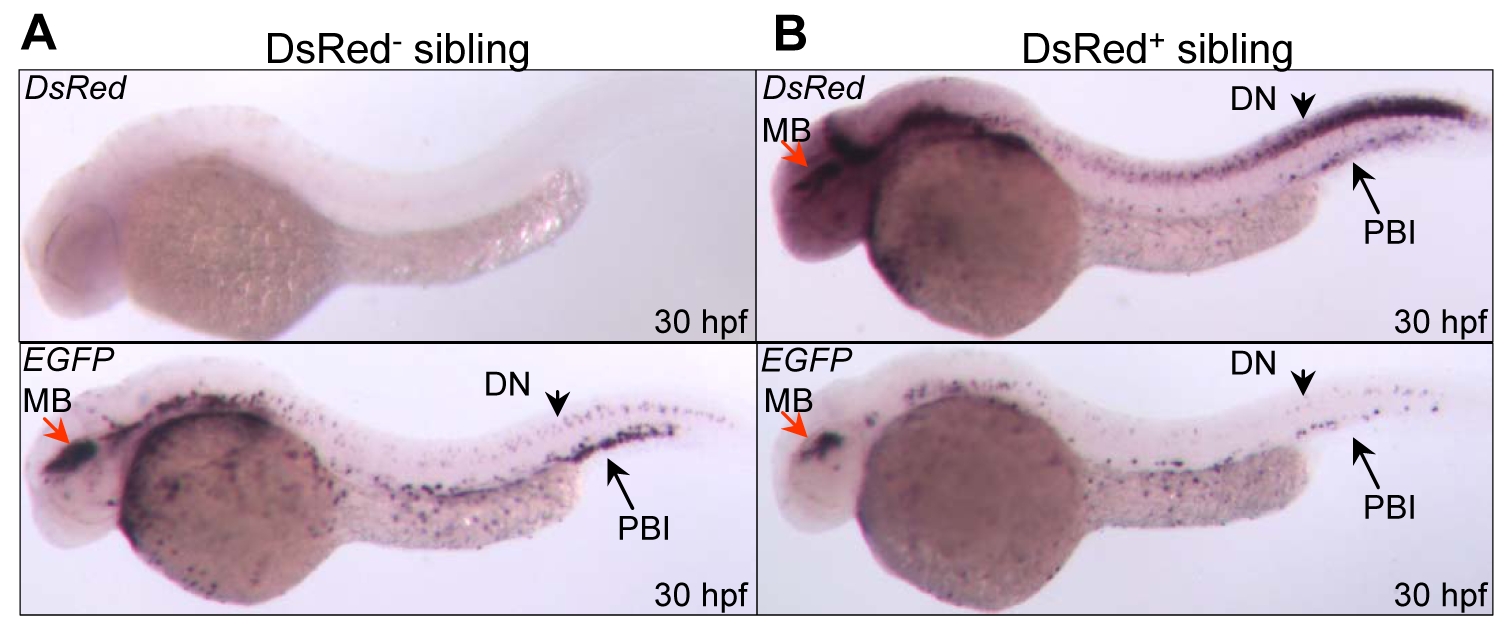
Fig. S3 Tissue-specific knockdown of chromosomally integrated EGFP transcripts. WISH analysis of EGFP and DsRed mRNA expression in DsRed- (A), and DsRed+ embryos (B) at 30 hpf. MB: midbrain; DN: dorsal neuron; PBI: posterior blood island.
Acknowledgments
This image is the copyrighted work of the attributed author or publisher, and
ZFIN has permission only to display this image to its users.
Additional permissions should be obtained from the applicable author or publisher of the image.
Full text @ PLoS One