
|
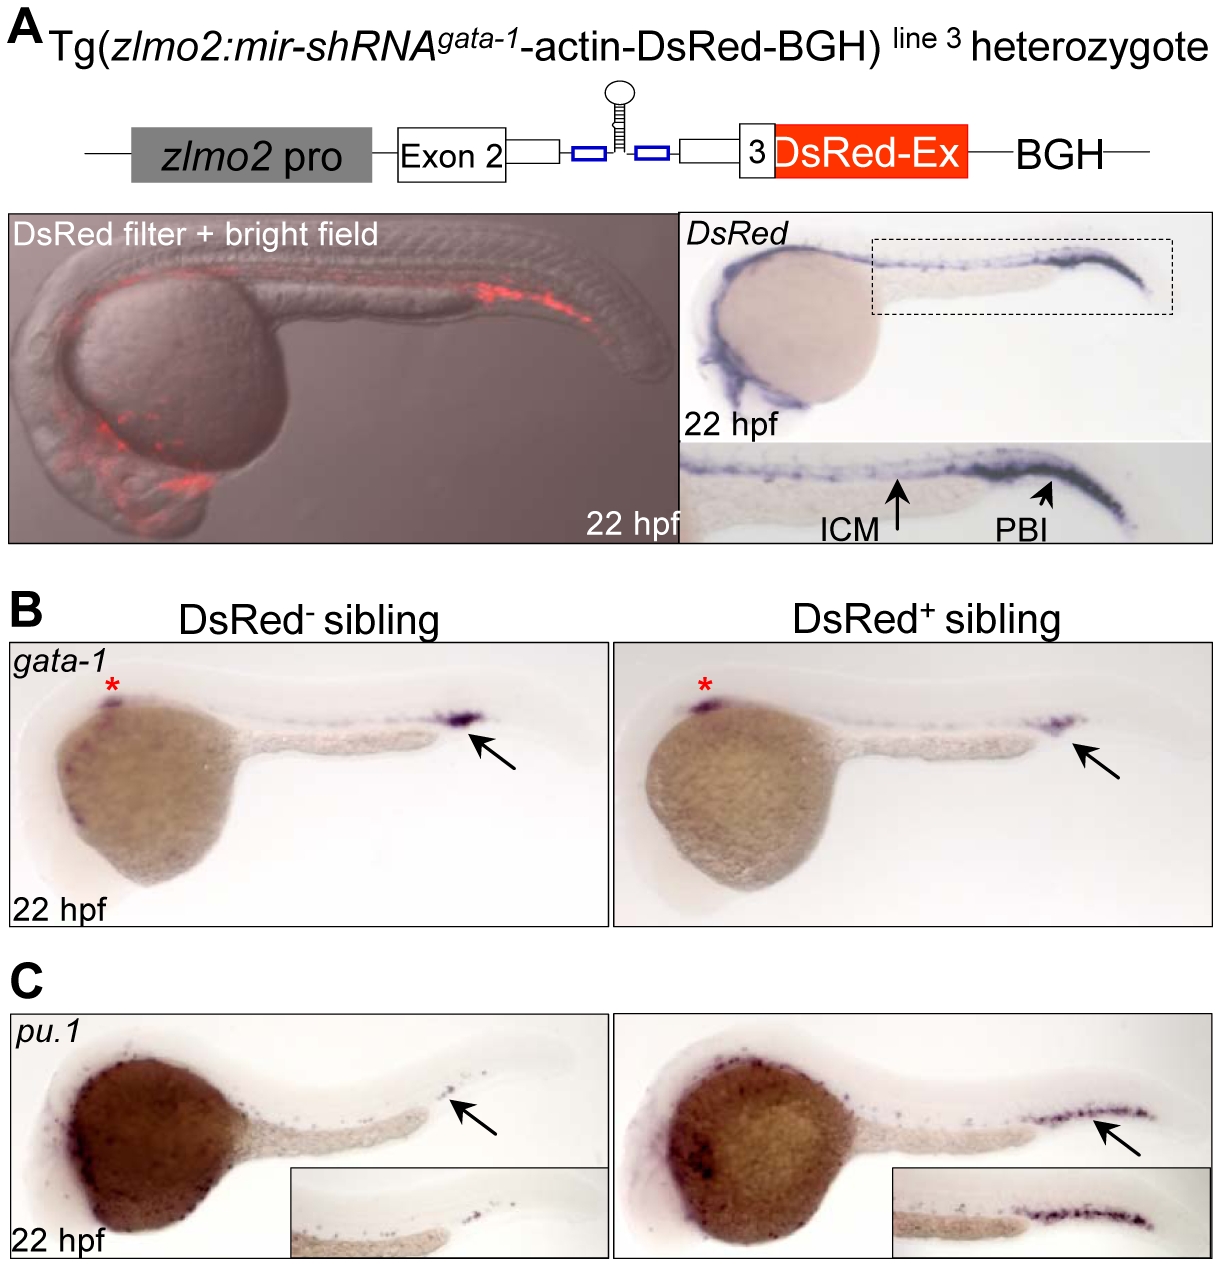
Fig. 7 Tissue-specific knockdown of endogenous gata-1 expression.
(A) The expression of DsRed fluorescence and transcripts recapitulates the endogenous lmo2 expression pattern in the Tg(zlmo2:mir-shRNAgata-1-actin-DsRed-BGH) line 3. Note that stronger expression of DsRed transcripts can be observed in the PBI region than in the ICM region. ICM: intermediate cell mass; PBI: posterior blood island. (B) WISH analysis of gata-1 expression in the DsRed- and DsRed+ F1 siblings at 22 hpf. Red star denotes the gata-1 staining in the developing kidney. (C) WISH analysis of pu.1 expression in the DsRed- and DsRed+ F1 siblings at 22 hpf. Note that the pu.1 staining is massively increased (arrow). All embryos are dorsal view with head to the left.