
|
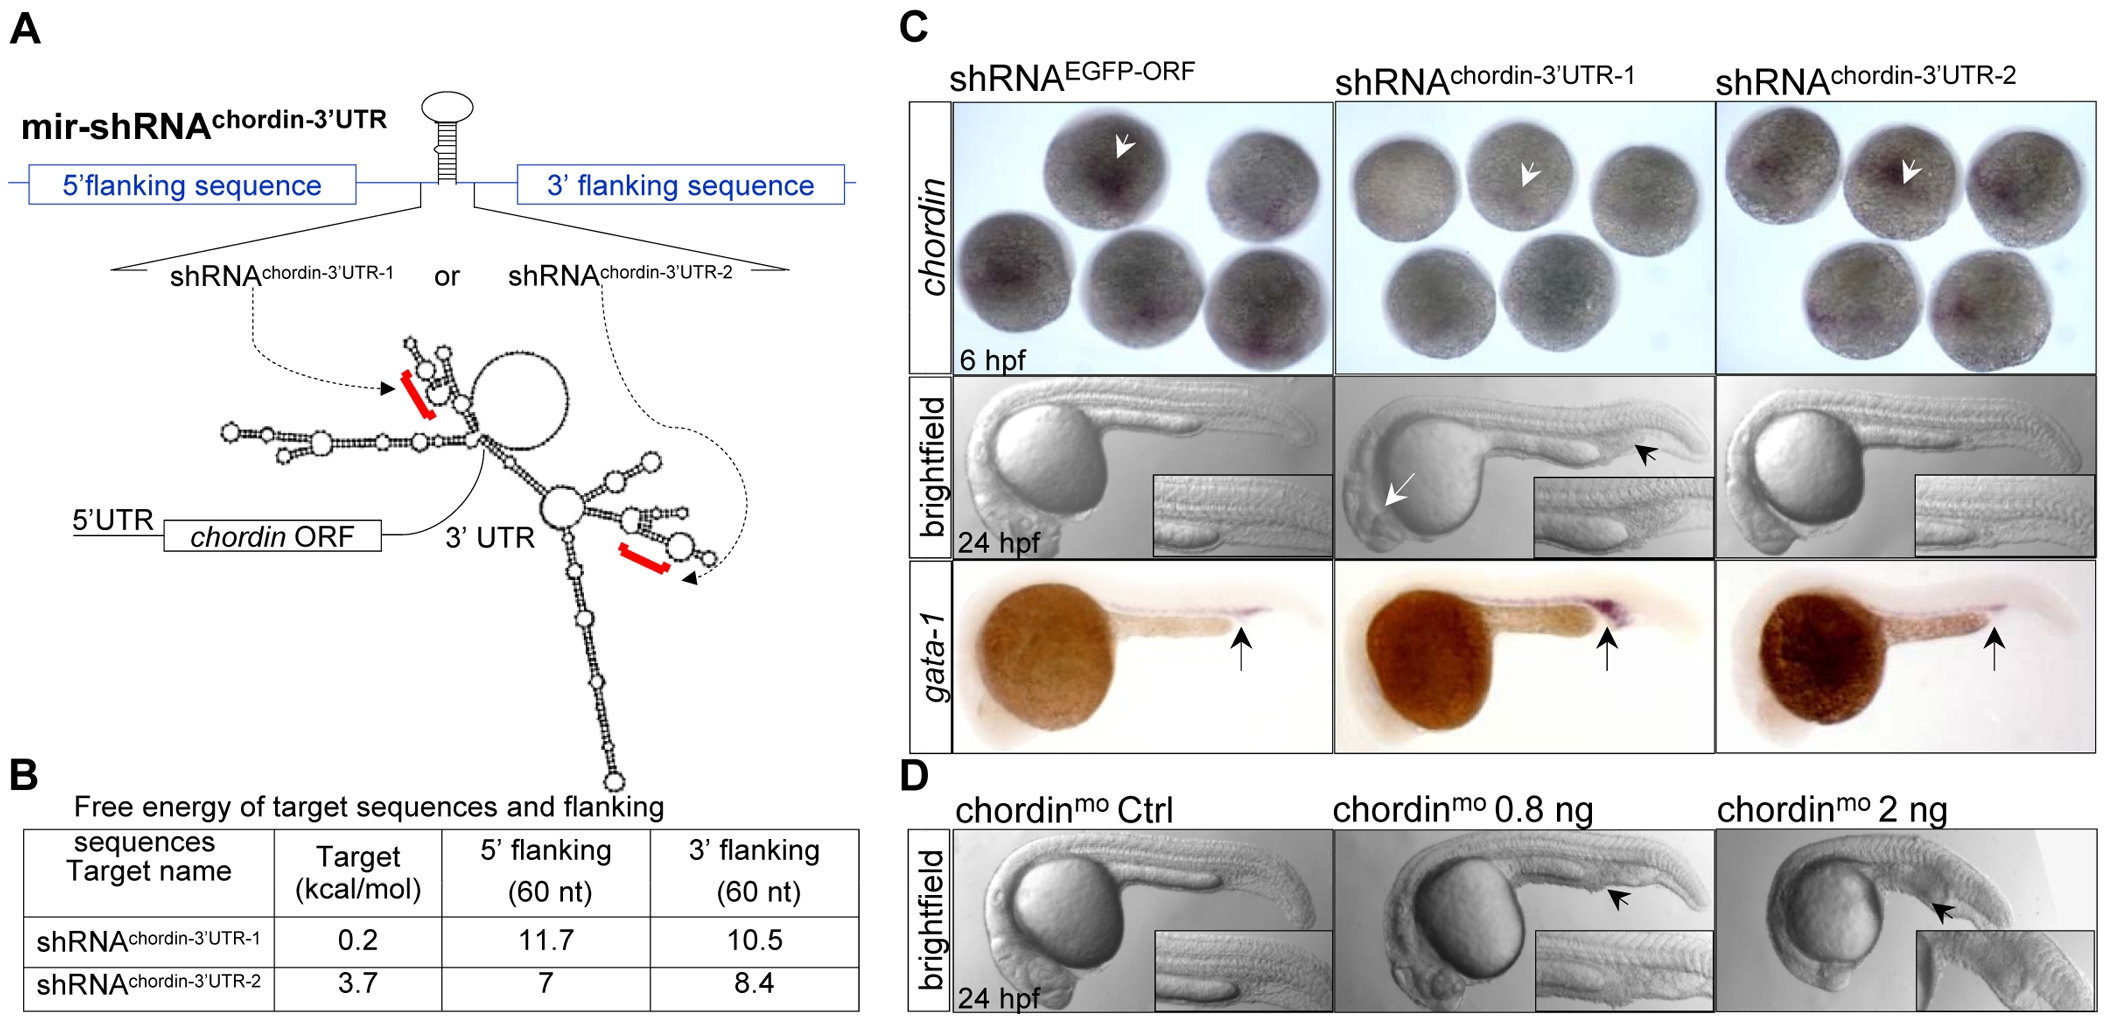
Fig. 3 Knockdown of endogenous cellular chordin expression.
(A) Diagram of mir- shRNAchordin-3′UTR-1 and mir-shRNAchordin-3′UTR-2 against the 3′UTR of chordin gene, whose predicted secondary structure was shown at the bottom. Red brackets denoted the targeted regions. (B) Free-energy of the targeted regions and corresponding flanking sequence predicted with mFold software. (C) Phenotypes of chordin-deficient embryos. WISH analysis of chordin expression in the 6 hpf embryos injected with 200 pg of shRNAEGFP-ORF (control), shRNAchordin-3′UTR-1 or shRNAchordin-3′UTR-2 mRNAs using a dig-labeled full-length 3′UTR of chordin as probe (upper panels). A significantly enlarged ICM (black arrowhead) with a partial loss of neural tissues (white arrow, 61/99) were observed in 24 hpf embryos injected with only shRNAchordin-3′UTR-1, but not with shRNAchordin-3′UTR-2 and control (middle panels). A higher level of gata-1 expression was also detected in the shRNAchordin-3′UTR-1-injected embryos, compared to control or shRNAchordin-3′UTR-2-injetced embryos (bottom panels). (D) Morphology of embryos injected with chordin morpholino oligonucleotides and its 4-base pair mismatch control. Embryos at 6 hpf are dorsal view, and embryos at 24 hpf are lateral views with head to the left.