
|
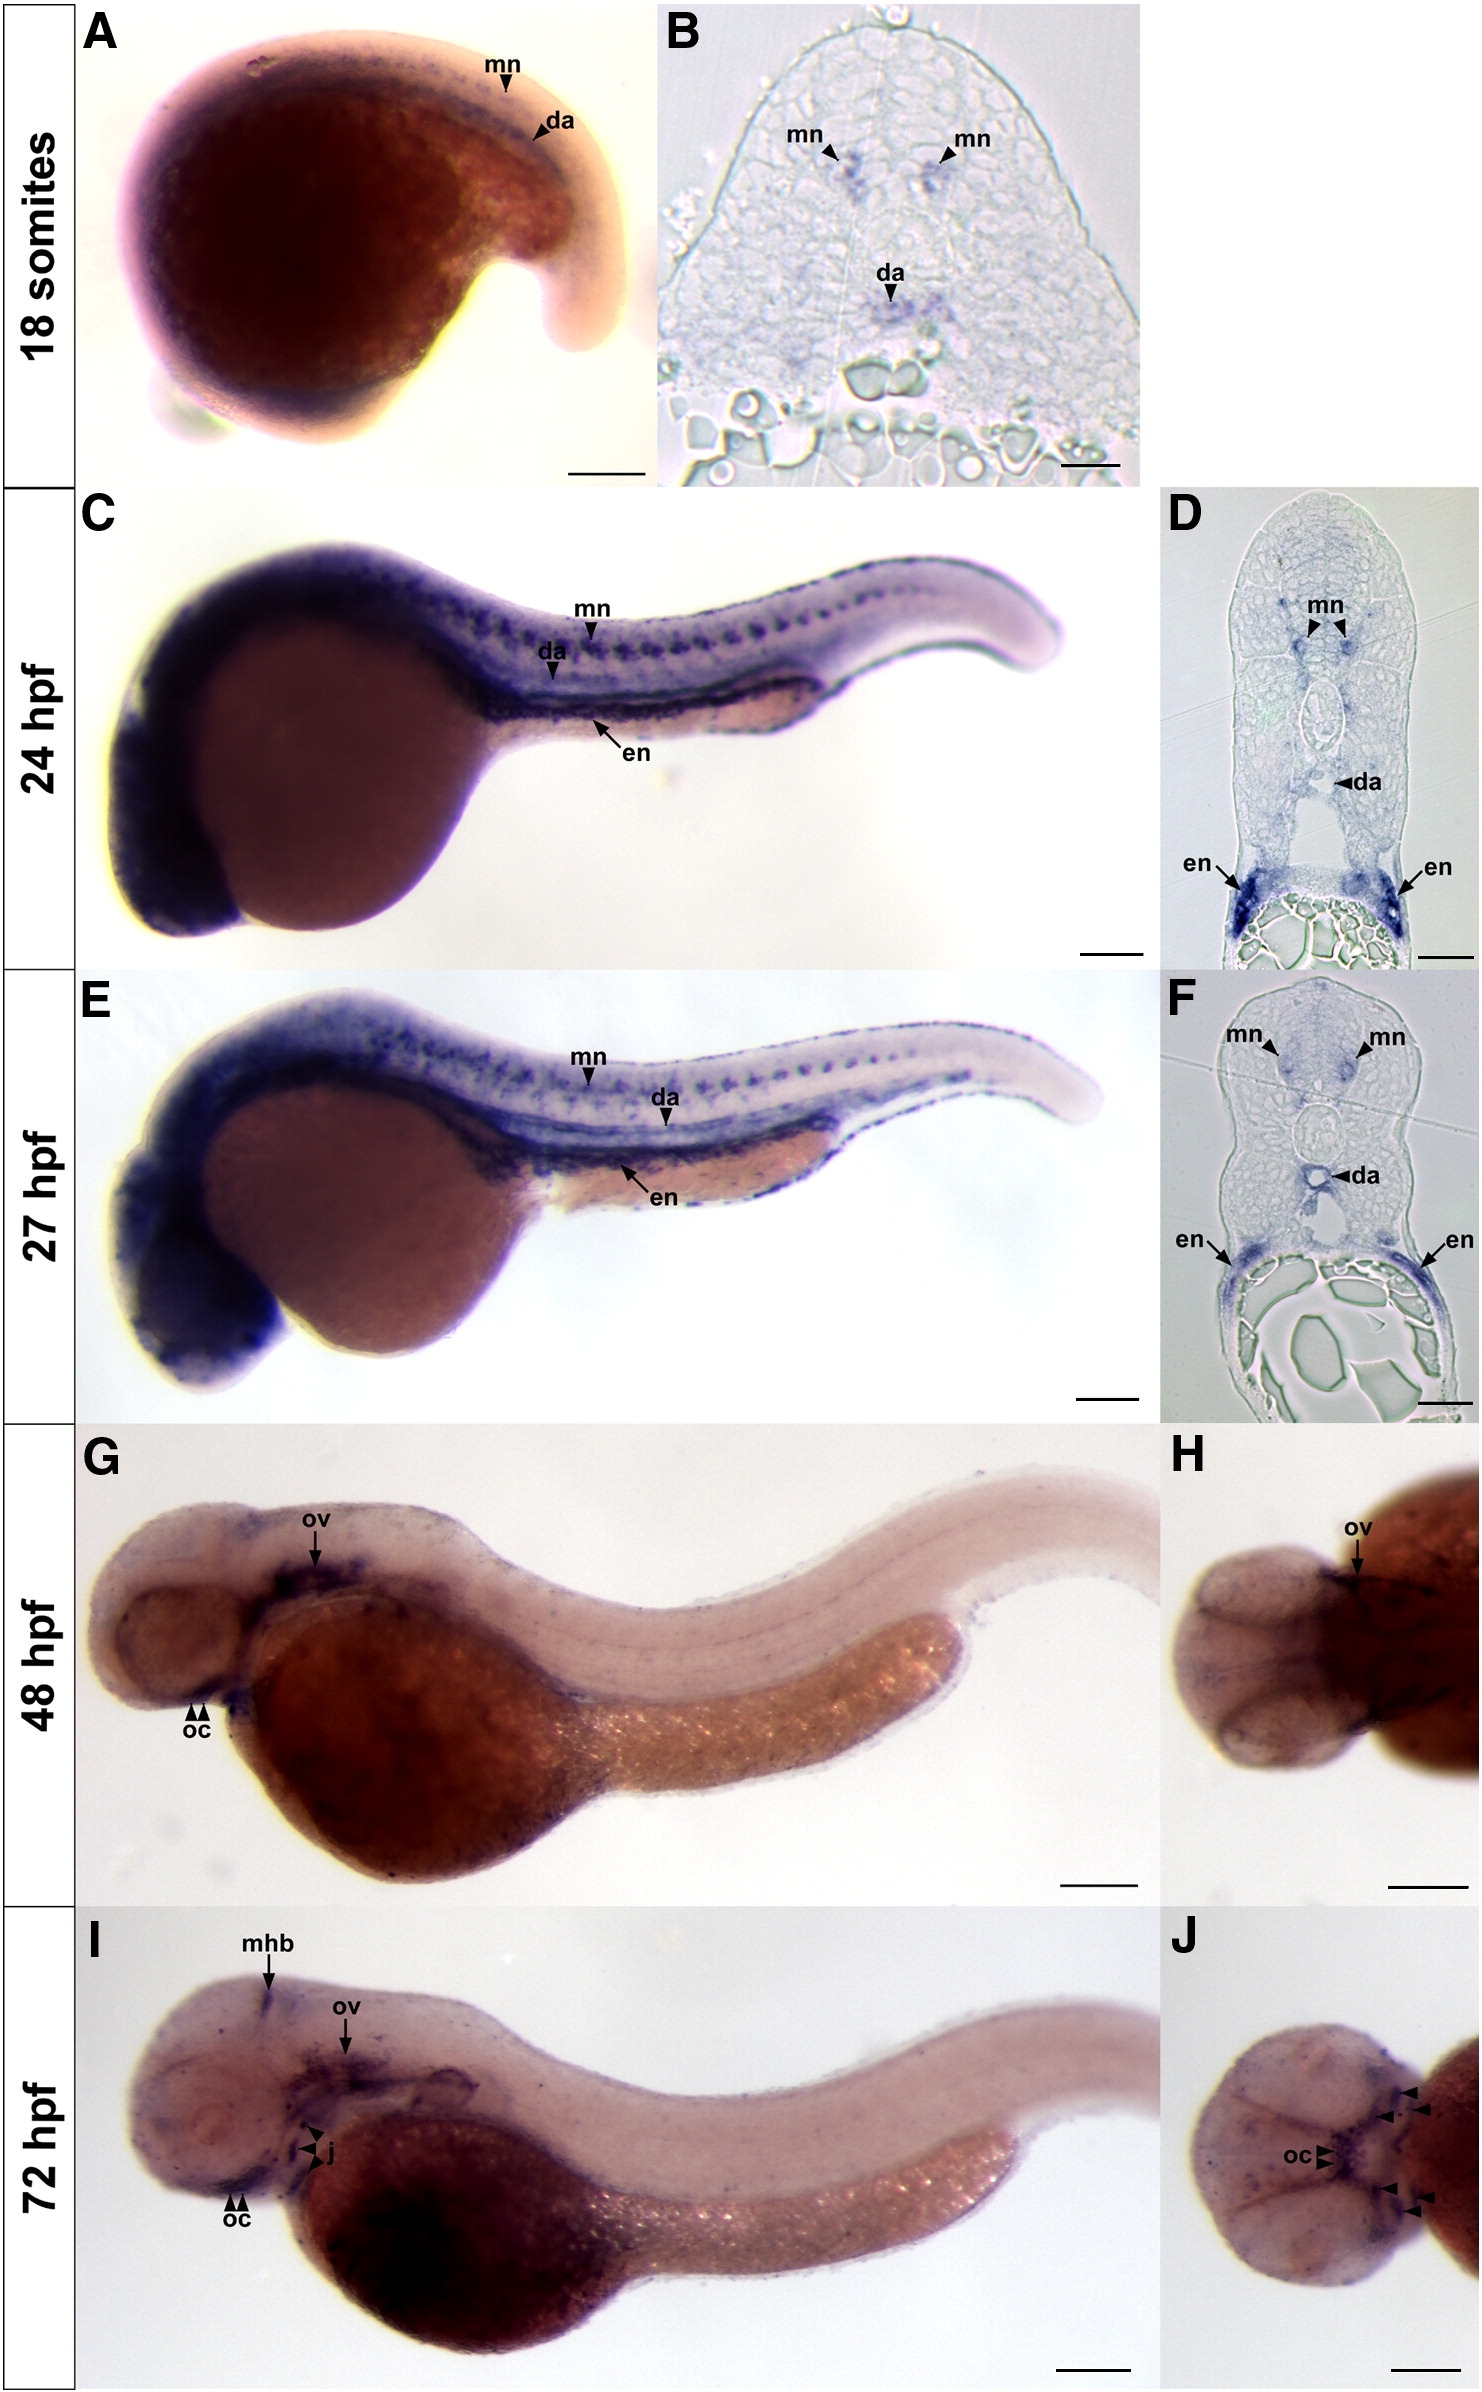
Fig. 1 Dynamic expression of zebrafish sema3e. (A, B). At 18 somites, sema3e is expressed in one primary motoneuron per somite (mn) and the dorsal aorta (da). (C–F) At 24 and 27 hpf, continued expression is observed in a single primary motoneuron and the dorsal aorta, with expression now observed in endodermal tissue ventral to the pronephric ducts (en). (G, H) By 48 hpf, only neural expression of sema3e is observed. Signal is seen in the otic vesicle (ov) and optic chiasm (oc); persisting through 72 hpf (I, J) where expression is also observed at the midbrain–hindbrain boundary (mhb) and in developing jaw structures (j). (A, C, E, G–J) are wholemount images while (B, D, F) are transverse sections. (A, C, E, G, I) are lateral views, (H) is dorsal view, (J) is ventral view. Scale bar in A is 325 μm, B is 10 μm, C, E, G–J is 400 μm, and D, F is 30 μm.
Reprinted from Developmental Biology, 331(2), Lamont, R.E., Lamont, E.J., and Childs, S.J., Antagonistic interactions among Plexins regulate the timing of intersegmental vessel formation, 199-209, Copyright (2009) with permission from Elsevier. Full text @ Dev. Biol.