
IMAGE
Fig. 2
- ID
- ZDB-IMAGE-090501-47
- Publication
- Dixon Fox et al., 2009 - Short- and long-range functions of Goosecoid in zebrafish axis formation are independent of Chordin, Noggin 1 and Follistatin-like 1b
- All Figures
- Figures for Dixon Fox et al., 2009
Image
|
Figure Caption
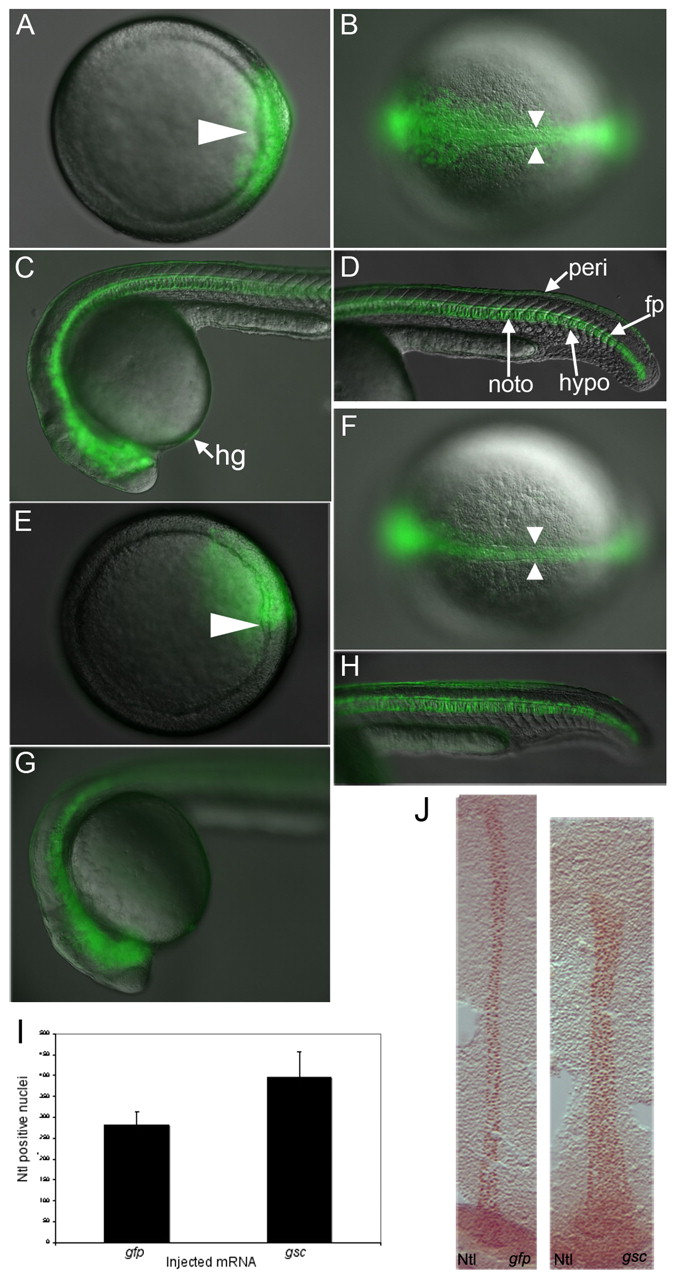
Fig. 2 Dorsal gsc overexpression induces excess dorsal tissue. (A-H) Merged images of live zebrafish embryo injected with gfp (A-D) or gsc (E-H) RNA. (A,E) Shield (arrowhead). (B,F) Bud, arrowheads indicate notochord. (C,D,G,H) 1 dpf. (I) Notochord cell counts with standard deviations, five embryos per treatment. (J) Bud, anterior to the top. Anti-Ntl staining is brown, injected RNA is listed in lower right. hypo, hypochord; peri, periderm.
Acknowledgments
This image is the copyrighted work of the attributed author or publisher, and
ZFIN has permission only to display this image to its users.
Additional permissions should be obtained from the applicable author or publisher of the image.
Full text @ Development