
IMAGE
Fig. 2
- ID
- ZDB-IMAGE-090408-51
- Genes
- Publication
- Borodovsky et al., 2009 - Neural protein Olig2 acts upstream of the transcriptional regulator sim1 to specify diencephalic dopaminergic neurons
- All Figures
- Figures for Borodovsky et al., 2009
Image
|
Figure Caption
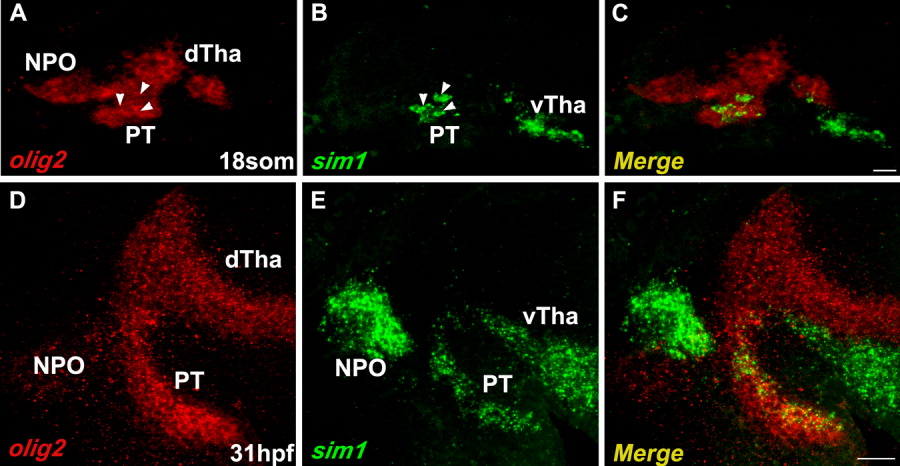
Fig. 2 Simultaneous expression analysis of sim1 and olig2 transcripts. Double fluorescent whole mount in situ hybridization of zebrafish embryos using digoxigenin (DIG)-labeled sim1 RNA probe (green) and fluorescein (FITC)-labeled olig2 RNA probe (red) at (A-C) 18 somites (som) and (D-F) 31 hr post fertilization (hpf). All images presented in lateral view, anterior to the left. dTha, dorsal thalamus; NPO, neurosecretory preoptic area; PT, posterior tuberculum; vTha, ventral thalamus. Scale bars = 36 μm in A-C; 22 μm in D-F.
Figure Data
Acknowledgments
This image is the copyrighted work of the attributed author or publisher, and
ZFIN has permission only to display this image to its users.
Additional permissions should be obtained from the applicable author or publisher of the image.
Full text @ Dev. Dyn.