
Fig. 2
- ID
- ZDB-IMAGE-090309-5
- Genes
- Publication
- Petrie-Hanson et al., 2009 - Characterization of rag1 mutant zebrafish leukocytes
- All Figures
- Figures for Petrie-Hanson et al., 2009
|
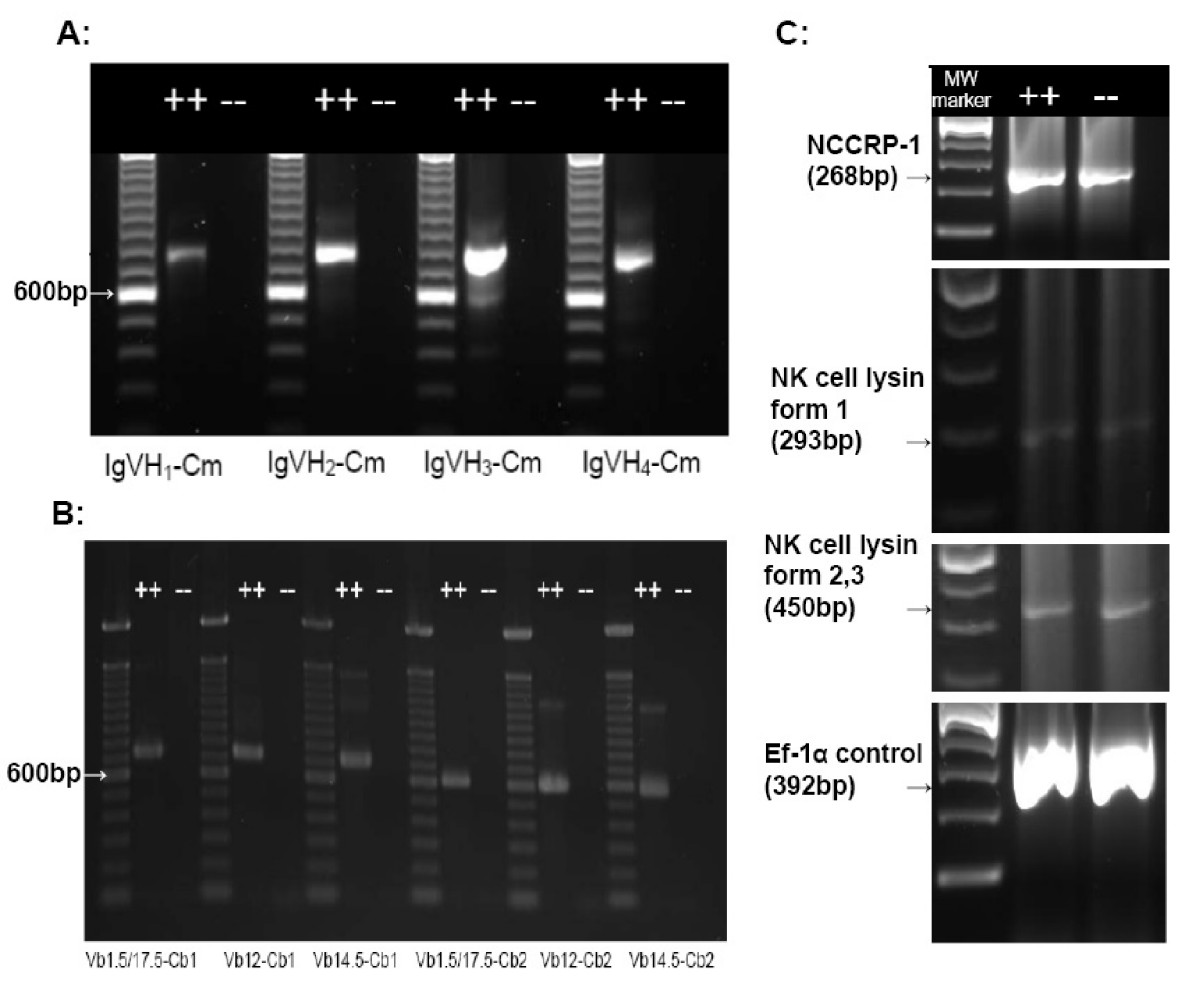
Fig. 2 RT-PCR analyses of mutant and wild-type zebrafish kidney hematopoietic tissue. Evaluation of expression of Immunoglobulin (Ig) heavy chain gene rearrangements, T-cell receptor (TCR) β chain rearrangements, NK-Lysin, NCC Receptor Protein-1 (NCCRP-1), and transcription elongation factor 1-α (EF1-α, as a positive control) in mutant and wild-type zebrafish by RT-PCR. (A) Nested RT-PCR using primers spanning VDJ-Cm in Ig VH1-VH4 [16]. (B) Nested RT-PCR using primers spanning TCR V(D)J-Cβ [16]. (C) RT-PCR was used to analyze mRNA expression using primers specific for NCCRP-1, NK lysin form 1, NK lysin forms 2 and 3 and EF1-α (primers are listed in Table 1). All RT-PCR assays included no-RT controls and no product was obtained (data not shown).