
Fig. 3
- ID
- ZDB-IMAGE-090306-38
- Publication
- Matthews et al., 2009 - TNF{alpha}-dependent hepatic steatosis and liver degeneration caused by mutation of zebrafish s-adenosylhomocysteine hydrolase
- All Figures
- Figures for Matthews et al., 2009
|
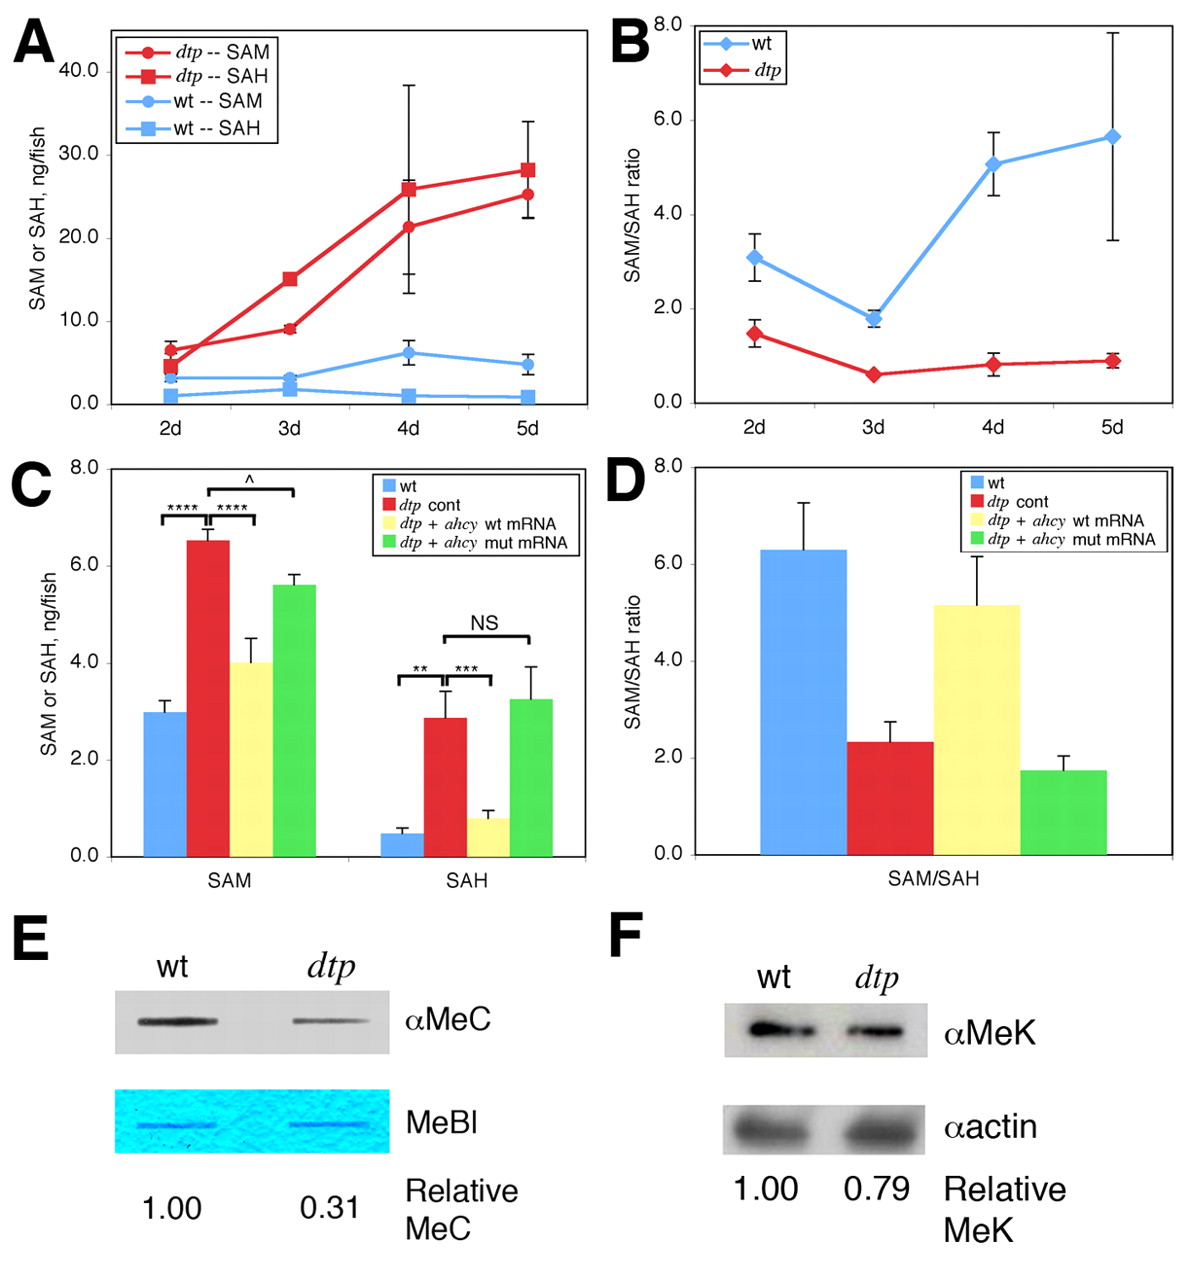
Fig. 3 Altered methionine and methyl metabolism in dtp larvae. (A) SAM and SAH levels, and (B) SAM:SAH ratio in wild-type (wt) and dtp zebrafish larvae. (C) SAM and SAH levels in 2-dpf wild-type and dtp embryos injected with control morpholino (dtp cont), and dtp embryos injected with either wild-type ahcy mRNA or mRNA carrying the ahcydtp missense mutation. ****P<0.00001, ***P<0.0001, **P<0.01, ^P<0.05; NS, not significant (P=0.3). (D) Calculated SAM:SAH ratio for the four conditions in C. Differences in the SAM:SAH ratio between B and D arise from experimental variation. (E) Anti-methylcytosine (αMeC) slot blot of genomic DNA derived from wild-type or dtp larvae, with Methylene Blue counterstain (MeBl). (F) Western blot showing reduced levels of methylated lysine residues (αMeK) in protein from dtp larvae; actin provided a loading control (αactin).