
Fig. 6
- ID
- ZDB-IMAGE-090112-6
- Genes
- Publication
- Meng et al., 2008 - Targeting retinal dopaminergic neurons in tyrosine hydroxylase-driven green fluorescent protein transgenic zebrafish
- All Figures
- Figures for Meng et al., 2008
|
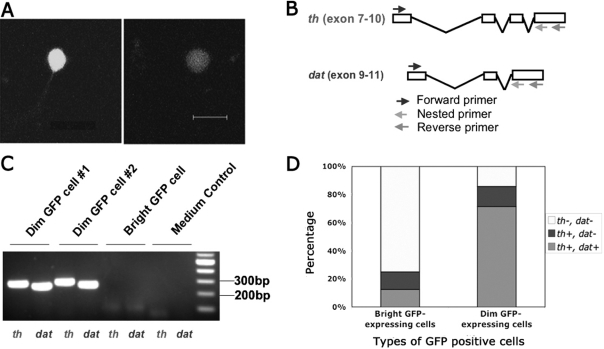
Fig. 6 Analysis of two subpopulations of GFP-positive cells using single-cell RT–PCR. A: Representative bright and dim GFP-positive cells in dispersed retinal culture were imaged at the same excitation intensity. Scale bar equals 10 μm. B: Schematic diagram shows the primers used for seminested PCR. For th, the size of the 2nd round PCR product was 277 bp. For dat, the size was 250 bp. C: Representative gel image shows the 2nd round PCR product from dim GFP cells, bright GFP cells, and medium control sample. Primer sets used were indicated at the bottom. D: Expression frequency of th and dat genes is different between bright GFP expressing cells and dim GFP expressing cells as assayed by single-cell RT–PCR. For bright GFP-expressing cells, 8 cells were examined. For dim GFP-expressing cells, 7 cells were examined.