
Fig. 1
- ID
- ZDB-IMAGE-090109-22
- Publication
- Rai et al., 2008 - DNA demethylation in zebrafish involves the coupling of a deaminase, a glycosylase, and gadd45
- All Figures
- Figures for Rai et al., 2008
|
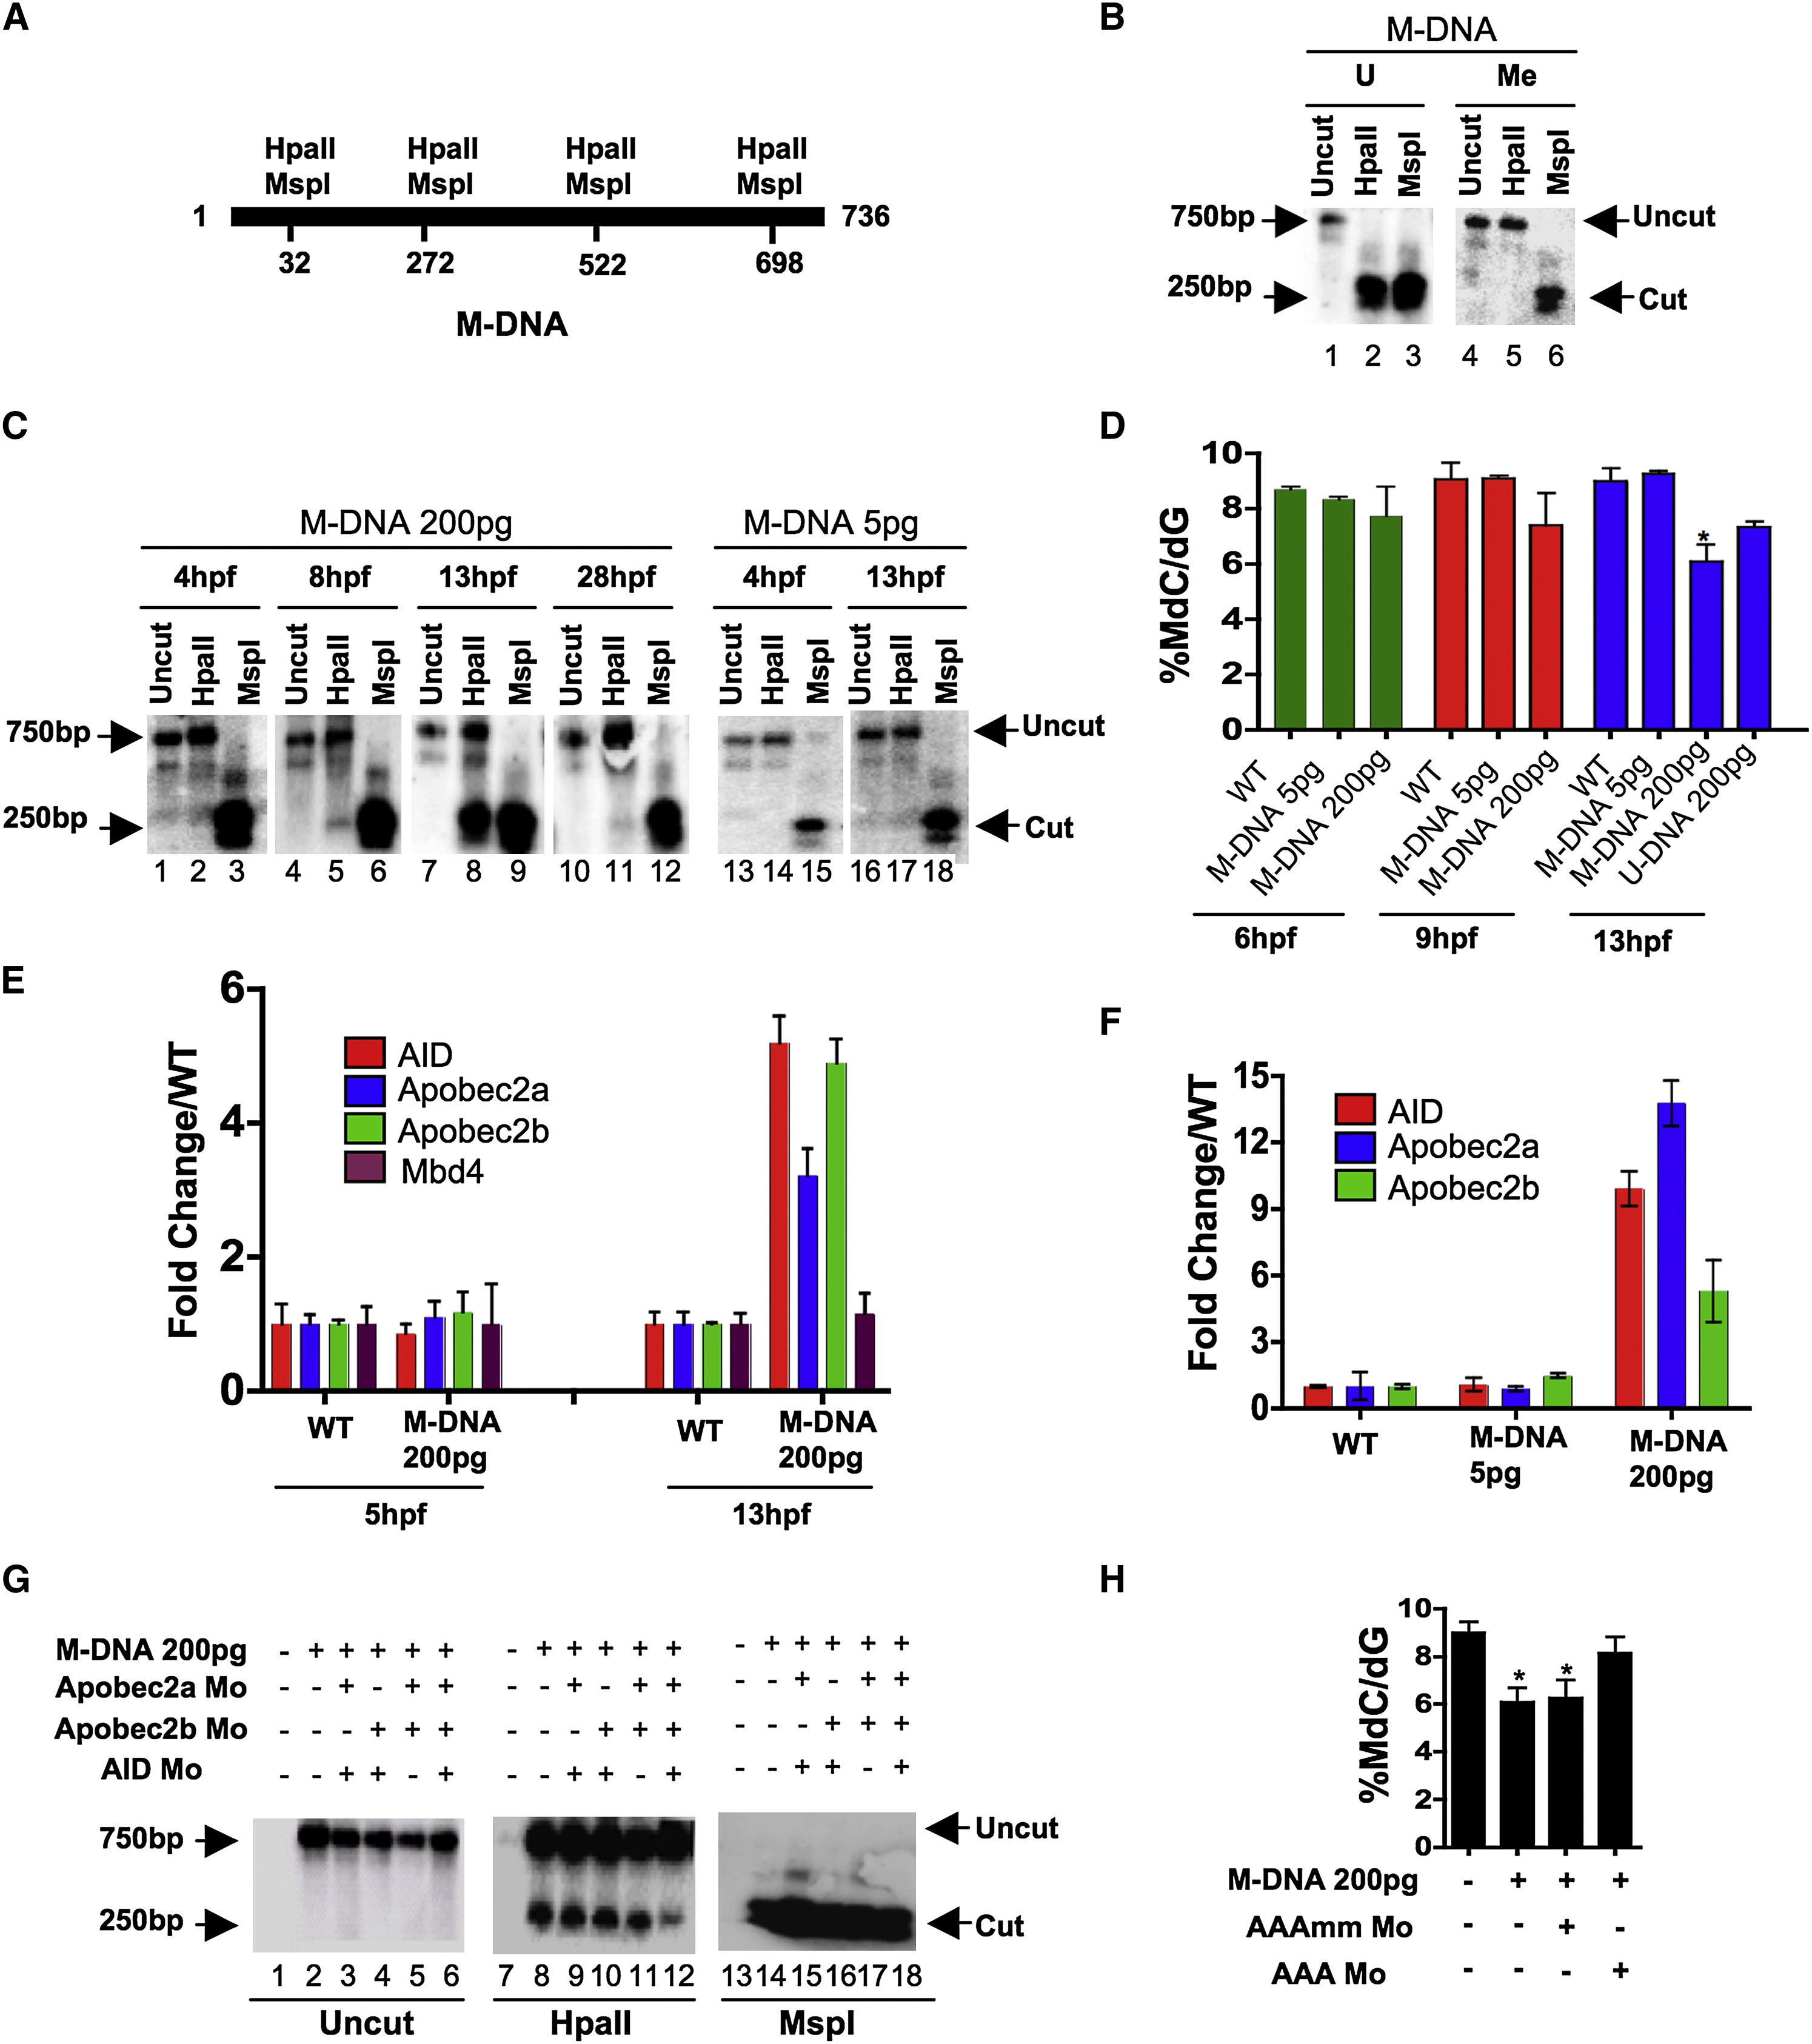
Fig. 1 Involvement of Cytidine Deaminases in DNA Demethylation in Zebrafish
(A) Schematic of the M-DNA (Methylated DNA) fragment injected into fertilized embryos at the single-cell stage. The four HpaII/MspI sites are indicated. HpaII-resistant (methylated CmeCGG) and HpaII-cleaved species (unmethylated) run at ∼750 bp and ∼250 bp, respectively (B).
(B) M-DNA methylation status was assessed by HpaII susceptibility, with cutting observed on unmethylated (U) (lane 2) but not methylated (Me) DNA (lane 2). MspI-digested (lanes 3 and 6) and uncut DNA (lanes 1 and 4) served as controls. Fragments were detected by Southern blot analysis probed with full-length M-DNA probe.
(C) M-DNA methylation status during development. Total DNA was isolated at the time points shown from embryos injected at the single-cell stage with M-DNA (5 pg or 200 pg), and treated as in (B). M-DNA induced demethylation peaks at ∼13 hpf (Compare lanes 2, 5, 8, and 11).
(D) LC-MS quantitation of 5-meC content of the bulk genome (normalized to total deoxyguanosine content) in genomic DNA isolated from embryos (hpf indicated) injected with methylated M-DNA or unmethylated U-DNA at the single-cell stage.
(E and F) qRT-PCR determinations from embryos injected with M-DNA (E), and at different fragment concentrations (F).
(G and H) Methylation status of M-DNA assessed by HpaII digestion and Southern blotting (G), or LC-MS quantitation of total 5-MeC (H) in total genomic DNA isolated from embryos at 13 hpf, injected at the single-cell stage with M-DNA (200 pg) and morpholinos as indicated. Lanes 1, 7, and 13 correspond to wild-type sample.
AAAmm refers to a set of three control morpholinos against AID (4 pg), Apobec2a (4 pg), and Apobec2b (2 pg) (AAA), which each contain five mismatched (mm) bases (of 25 total to prevent binding) relative to the efficacious morpholino (same amount as controls). For HpaII/MspI susceptibility, one representative of at least three biological repeats is shown. LC-MS measurements; two biological replicates. Asterisks (*) depict statistical significance (p < 0.05). Error bars: +/- one standard deviation.
Reprinted from Cell, 135(7), Rai, K., Huggins, I.J., James, S.R., Karpf, A.R., Jones, D.A., and Cairns, B.R., DNA demethylation in zebrafish involves the coupling of a deaminase, a glycosylase, and gadd45, 1201-1212, Copyright (2008) with permission from Elsevier. Full text @ Cell