
Fig. 2
- ID
- ZDB-IMAGE-080919-11
- Genes
- Publication
- Fürthauer et al., 1999 - Three different noggin genes antagonize the activity of bone morphogenetic proteins in the zebrafish embryo
- All Figures
- Figures for Fürthauer et al., 1999
|
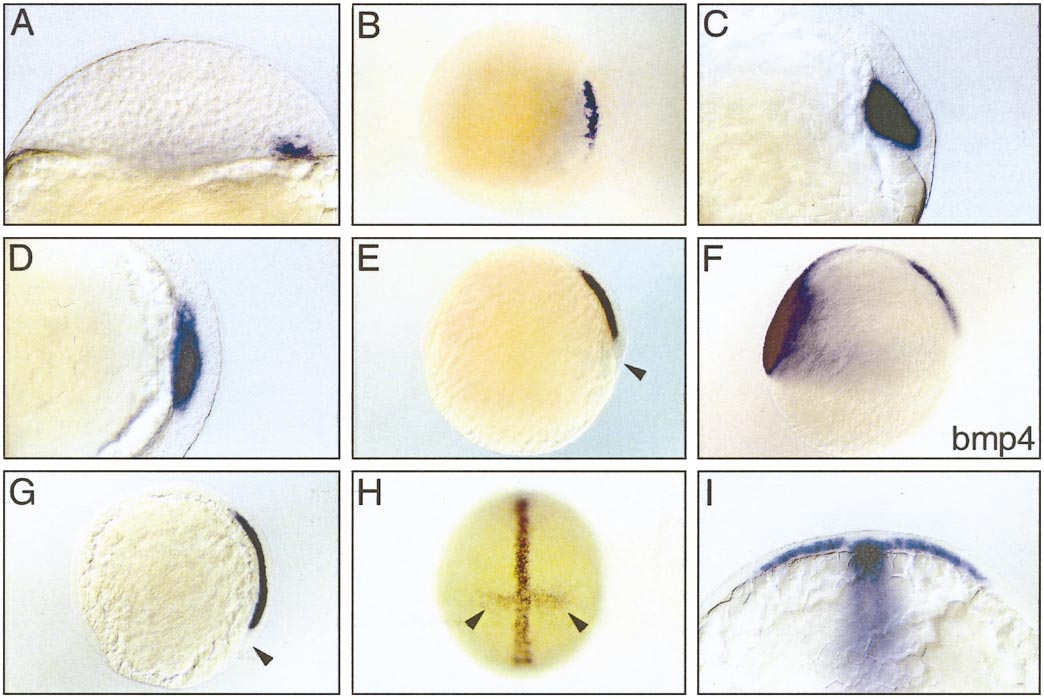
Fig. 2 Noggin1 expression at blastula and gastrula stages. (A) At sphere stage nog1 transcripts become detectable in the dorsal marginal region. (B) At 30% epiboly, nog1 is expressed in a 45° crescent at the dorsal margin. (C) With the beginning of gastrulation, nog1 is expressed in the leading cells of the involuting hypoblast. (D) Optical cross section at the level of the shield shows that nog1 expression is restricted to the mesendoderm. (E) At 60% epiboly, nog1 is expressed throughout the axial hypoblast with exception of the marginal region (arrowhead). (F) In the dorsal part of the embryo, bmp4 is expressed in the same territory as nog1. (G) At 75% epiboly, nog1 is expressed in prechordal plate and axial mesoderm. Marginal cells do not express nog1 (arrowhead). (H) At the end of gastrulation a transversal stripe of diffuse nog1 expression becomes detectable at the level of the anterior segmental plate (arrowheads). (I) An optical cross section at this level shows that the paraxial expression is hypoblastic. (A, C, E, F, G) Lateral view. (B) Animal pole view. (D) Transversal optical cross section at the level of the shield. (H) Dorsal view. (I) Optical cross section at the level of the prospective anterior segmental plate, dorsal is up. Unless indicated otherwise, dorsal is to the right.
Reprinted from Developmental Biology, 214(1), Fürthauer, M., Thisse, B., and Thisse, C., Three different noggin genes antagonize the activity of bone morphogenetic proteins in the zebrafish embryo, 181-196, Copyright (1999) with permission from Elsevier. Full text @ Dev. Biol.