
Fig. 4
- ID
- ZDB-IMAGE-080910-8
- Publication
- Wu et al., 2008 - Multiple regulatory elements mediating neuronal-specific expression of zebrafish sodium channel gene, Scn8aa
- All Figures
- Figures for Wu et al., 2008
|
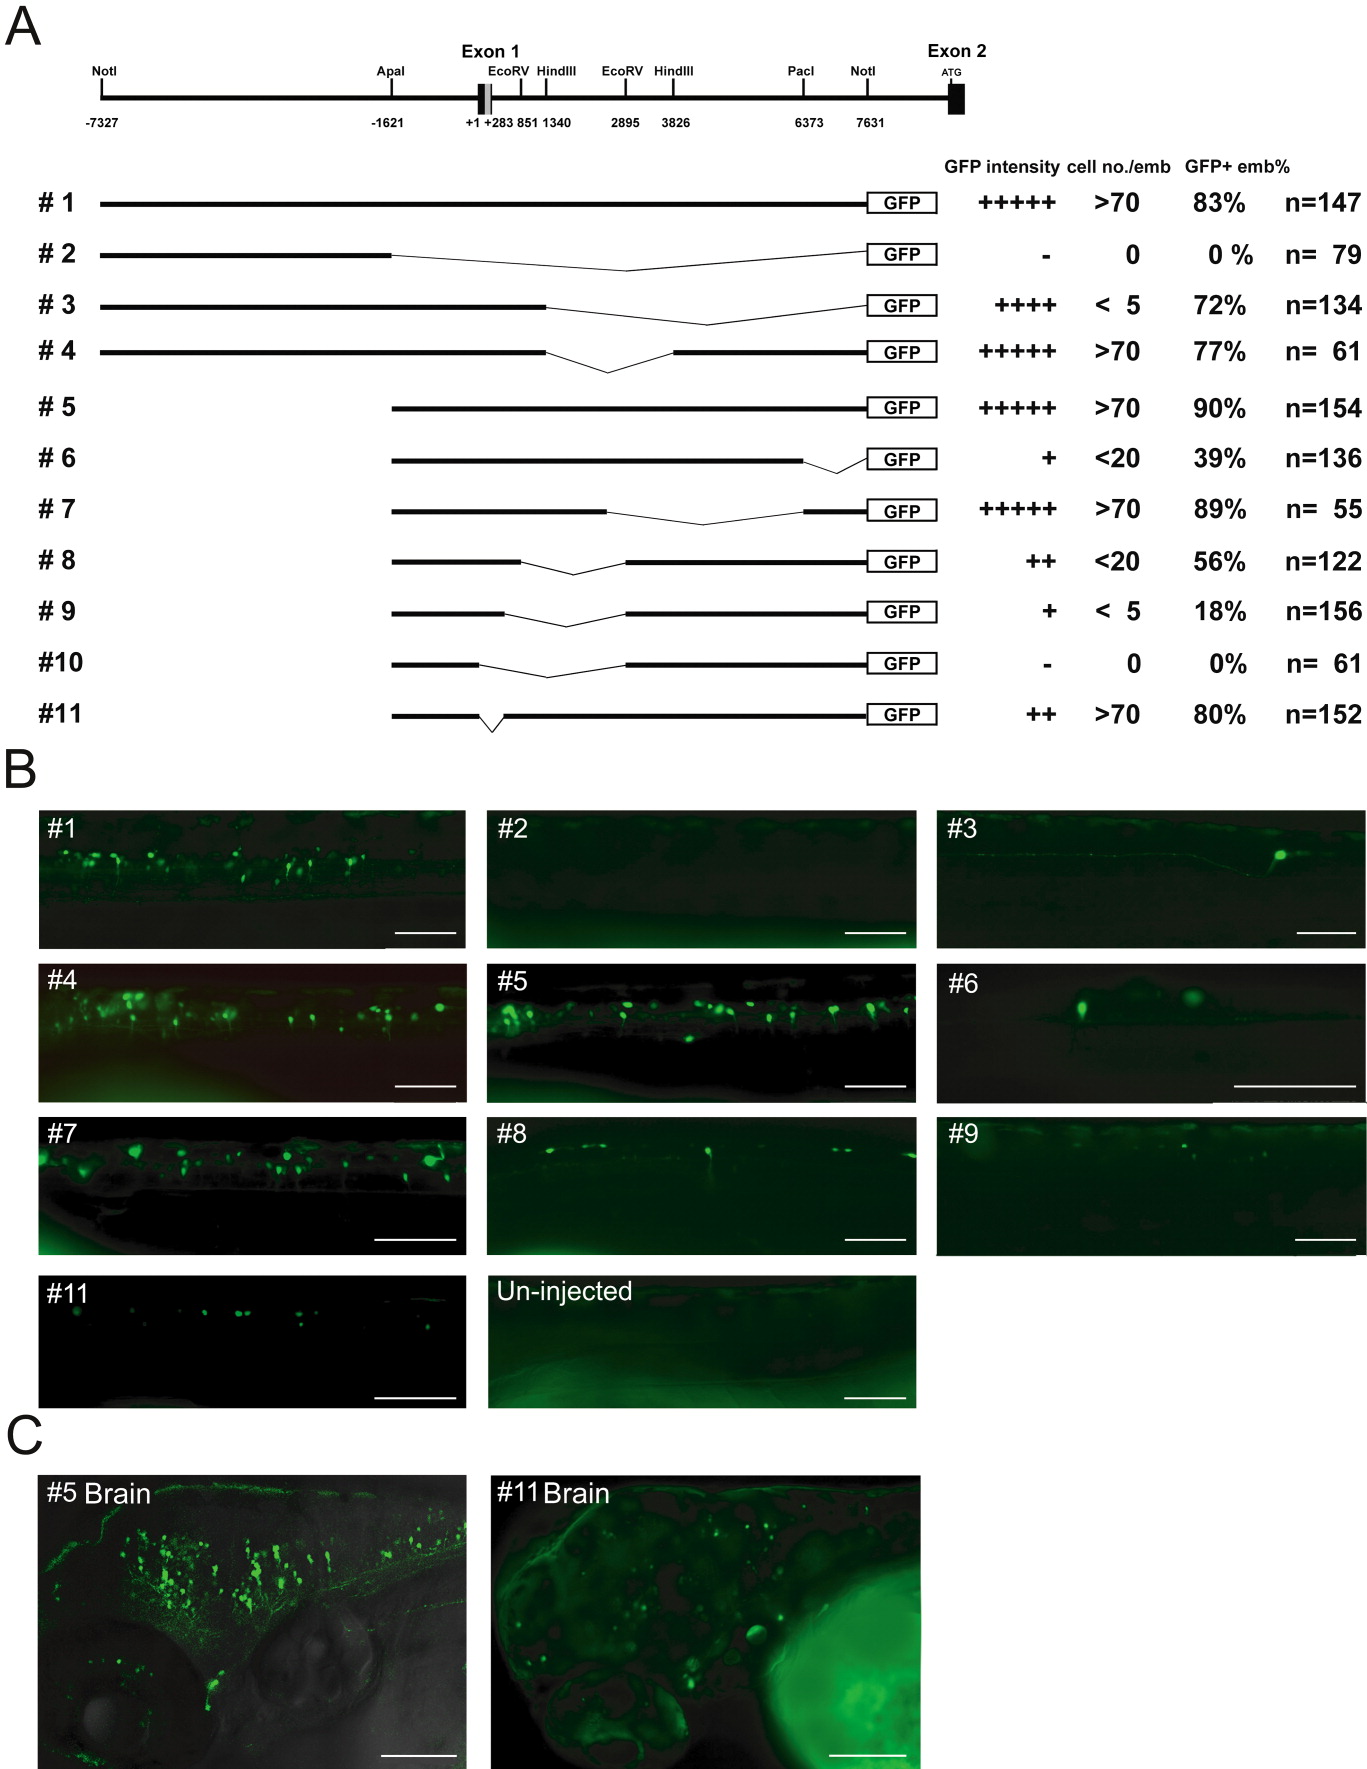
Fig. 4 Deletion analysis of the 15-kb regulatory fragment of scn8aa. A: The gray area represents the conserved regulatory element shared with mouse SCN8A. GFP intensity, average number of GFP-positive neurons per embryo (cell no/emb), and percentage of GFP-positive embryos are determined following the transient expression of the indicated deletion construct until 72 hpf. GFP intensity is scored on a six-point scale with “+++++” representing strongest expression and “-” representing no detectable expression. The total number of injected embryos with normal morphology is represented by n. B: Lateral views of GFP expression in embryos injected with the indicated deletion constructs. C: Confocal images of the brains of embryos injected with construct #5 or #11. The #11-injected embryo is subjected to a prolonged exposure due to the low intensity of GFP. Scale bars = 100 μm.