
|
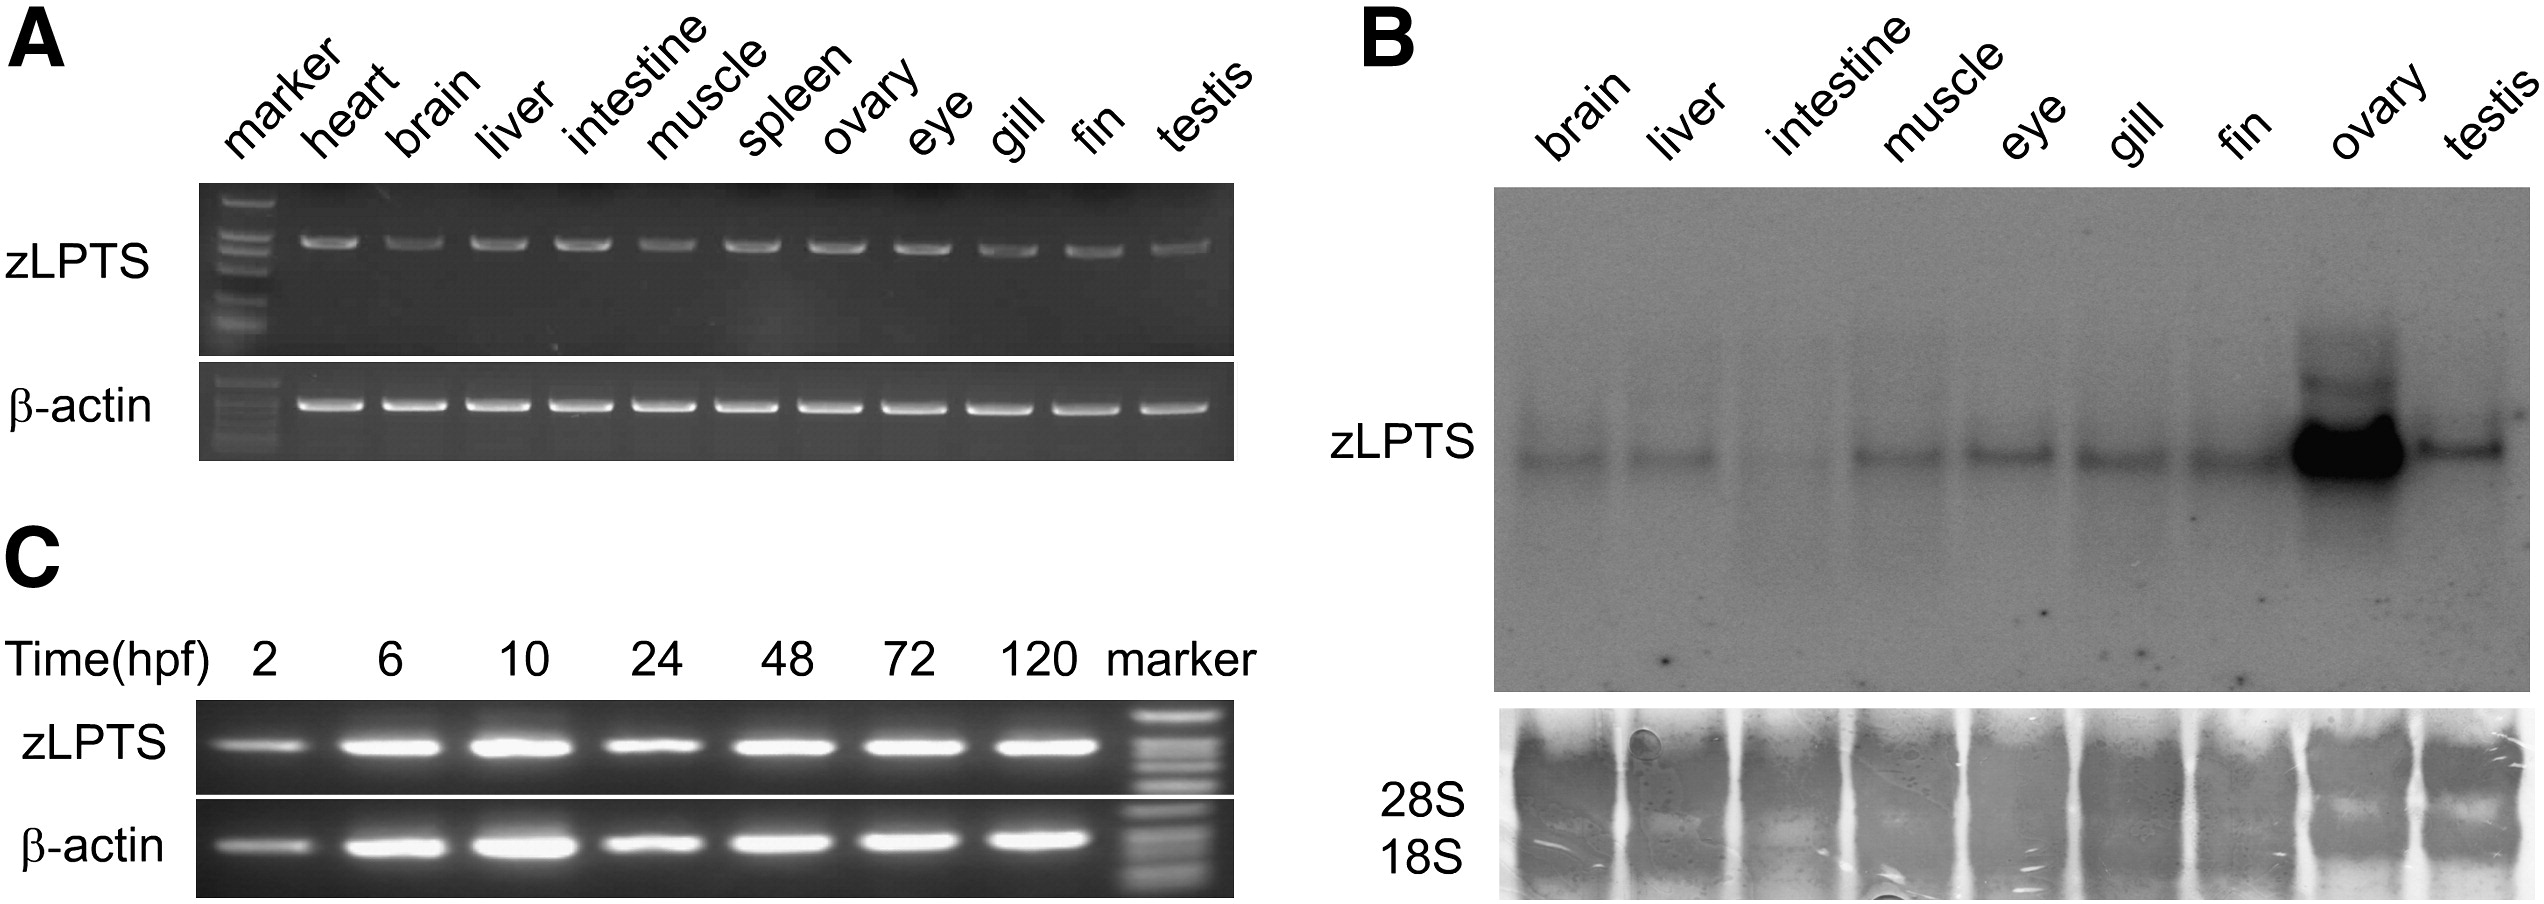
Fig. 2 The expression patterns of zLPTS in zebrafish tissues and embryos. (A) RT-PCR analysis of zLPTS transcript in 11 zebrafish tissues as indicated. (B) Northern blotting analysis of zLPTS transcript in 9 zebrafish tissues as indicated. Hybridization was performed with a ∼ 800 bp, α-32P-labeled DNA fragment of zLPTS. The below 28S and 18S rRNA, stained by methylene blue, was used as a loading control. (C) RT-PCR analysis of zLPTS transcript in embryos at different times after fertilization (hour postfertilization, hpf). Zebrafish β-actin was served as a control. DL2000 (DNA Marker, TaKaRa) was loaded as a marker.
Reprinted from Gene, 420(1), Sun, C., Wu, Z., Jia, F., Wang, Y., Li, T., and Zhao, M., Identification of zebrafish LPTS: A gene with similarities to human LPTS/PinX1 that inhibits telomerase activity, 90-98, Copyright (2008) with permission from Elsevier. Full text @ Gene