
IMAGE
Fig. 6
- ID
- ZDB-IMAGE-080715-30
- Genes
- Publication
- Liu et al., 2008 - In vivo time-lapse imaging delineates the zebrafish pituitary proopiomelanocortin lineage boundary regulated by FGF3 signal
- All Figures
- Figures for Liu et al., 2008
Image
|
Figure Caption
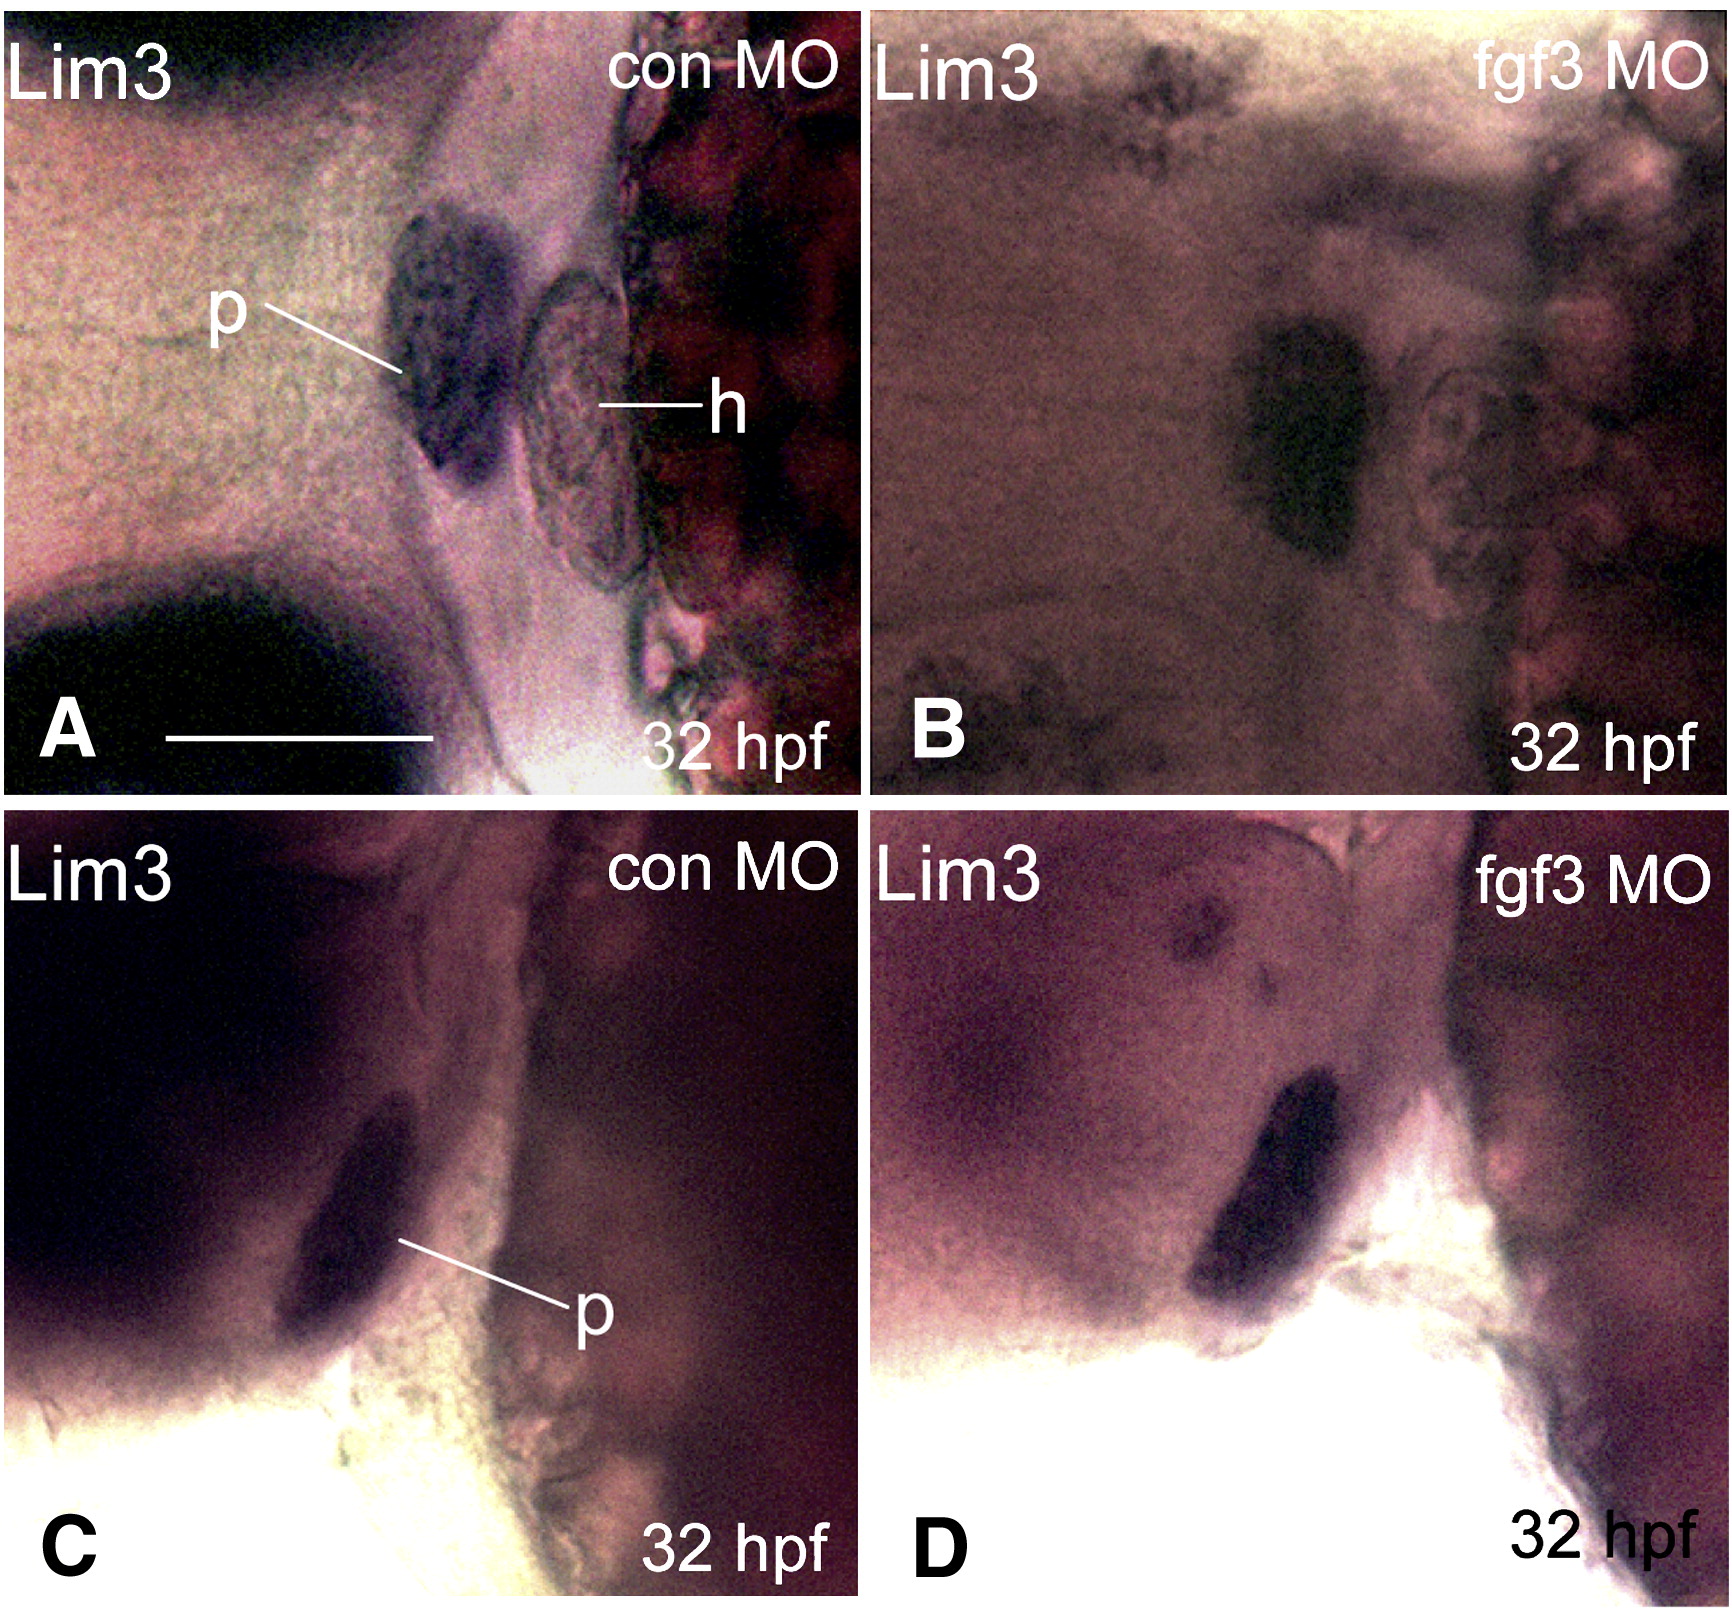
Fig. 6 Hypomorphic FGF3 morphants exhibit intact Lim3 expression at 32 hpf. 1–2 cell stage POMC-GFP transgenic embryos were injected with either 0.4 ng/embryo standard control MO (E and G) or FGF3 MO (F and H) and then cultured in routine medium. At 32 hpf, Lim3 in situ hybridization was performed. E and F: frontal view; left, top. G, H: lateral view; left, anterior; right, posterior. p, pituitary; h, heart. Scale bar, 50 μm.
Figure Data
Acknowledgments
This image is the copyrighted work of the attributed author or publisher, and
ZFIN has permission only to display this image to its users.
Additional permissions should be obtained from the applicable author or publisher of the image.
Reprinted from Developmental Biology, 319(2), Liu, N.A., Ren, M., Song, J., Ríos, Y., Wawrowsky, K., Ben-Shlomo, A., Lin, S., and Melmed, S., In vivo time-lapse imaging delineates the zebrafish pituitary proopiomelanocortin lineage boundary regulated by FGF3 signal, 192-200, Copyright (2008) with permission from Elsevier. Full text @ Dev. Biol.