
Fig. 4
- ID
- ZDB-IMAGE-080604-72
- Genes
- Antibodies
- Publication
- Peri et al., 2008 - Live Imaging of Neuronal Degradation by Microglia Reveals a Role for v0-ATPase a1 in Phagosomal Fusion In Vivo
- All Figures
- Figures for Peri et al., 2008
|
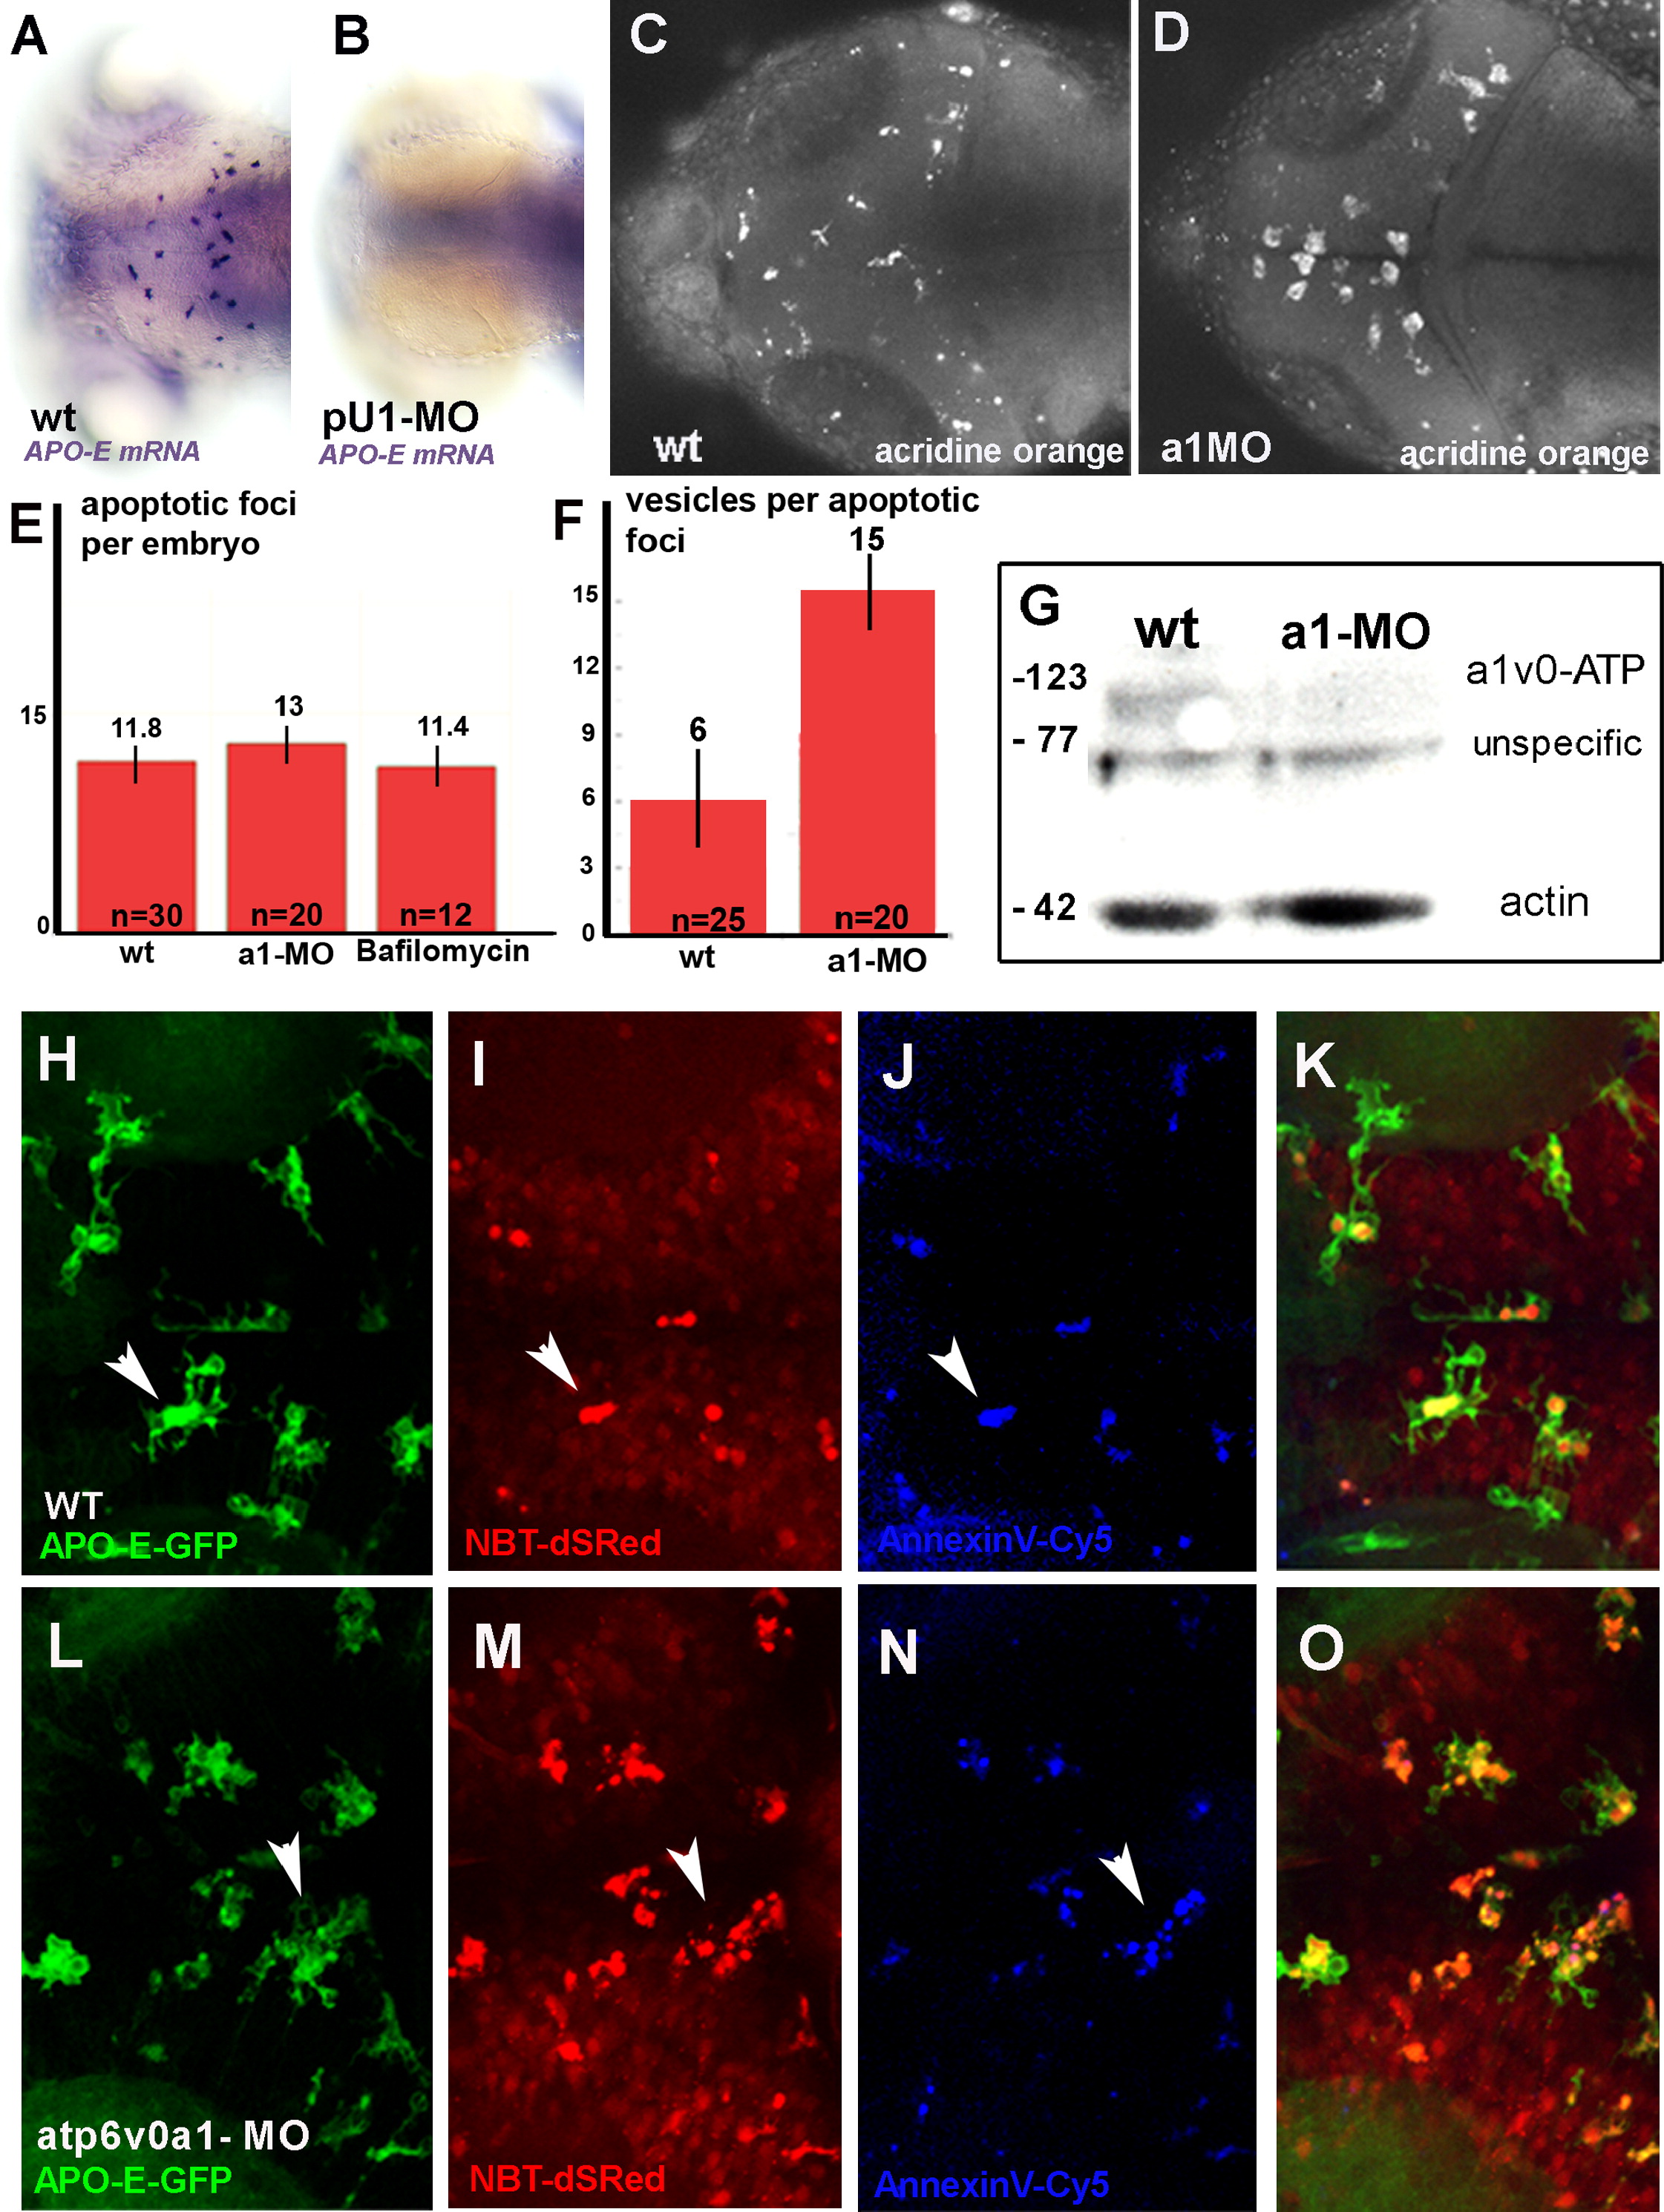
Fig. 4 Accumulation of Apoptotic Neuronal Material in v0-ATPase a1 Knocked-Down Microglia
(A and B) Apo-E-expressing cells have a myeloid origin. Dorsal view of the wild-type fish head at 3 dpf (days post fertilization). (A) apo-E mRNA expression in the wild-type embryo. (B) apo-E mRNA is not detectable in embryos injected with a morpholino directed against the pU1 transcription factor, whose activity is required for myeloid cells specification.
(C and D) Dorsal view of the wild-type fish head at 3 dpf (days post fertilization). Acridine orange stainings detect apoptosis in the CNS. Levels of apoptosis within the CNS are comparable in wild-type (C) and atp6v0a1-MO embryos (D).
(E) Quantification of the number of apoptotic clusters per embryo. The values are comparable between wild-type, atp6v0a1-MO and Bafilomycin-A1 treated microglia. The data represent the average ± SD of ten independent experiments.
(F) Quantification of the apoptotic cluster size. Apoptotic foci in atp6v0a1-MO embryos are three times larger then in the wild-type. These values were obtained by counting the number of red vesicles per cluster in different experiments. The data represent the average ± SD of ten independent experiments.
(G) Western blotting analysis using a polyclonal antibody directed against v0-ATpase a1. This shows that the expected 116kDa band, presents in extracts of 3 dpf uninjected embryos, is absent in extracts obtained from atp6v0a1 3 dpf knockdown embryos. This confirms the efficacy of the morpholino mediated knockdown.
(H–K) Dorsal view of the wild-type fish head at 3 dpf (days post fertilization). Foci of apoptotic neurons are found inside wild-type microglia. (H) Apo-E-GFP expression. (I) NBT-dSRed expression. (J) AnnexinV-Cy5 labeling of apoptotic clusters. (K) Merge. White arrowhead points at one single apoptotic neuronal cluster.
(L–O) Dorsal view of the fish head at 3 dpf (days post fertilization) in atpv0a1 morpholino injected embryos. Foci of apoptotic neurons are larger then in wild-type. (L) Apo-E-GFP expression. (M) NBTdSRed expression. (N) AnnexinV-Cy5 labeling of apoptotic clusters. (O) Merge. White arrowhead points at one single apoptotic neuronal cluster. The size of the cluster is larger when compared to the wild-type.
Reprinted from Cell, 133(5), Peri, F., and Nüsslein-Volhard, C., Live Imaging of Neuronal Degradation by Microglia Reveals a Role for v0-ATPase a1 in Phagosomal Fusion In Vivo, 916-927, Copyright (2008) with permission from Elsevier. Full text @ Cell