
IMAGE
Fig. S1
- ID
- ZDB-IMAGE-080506-9
- Publication
- Hong et al., 2008 - The Mych Gene Is Required for Neural Crest Survival during Zebrafish Development
- All Figures
- Figures for Hong et al., 2008
Image
|
Figure Caption
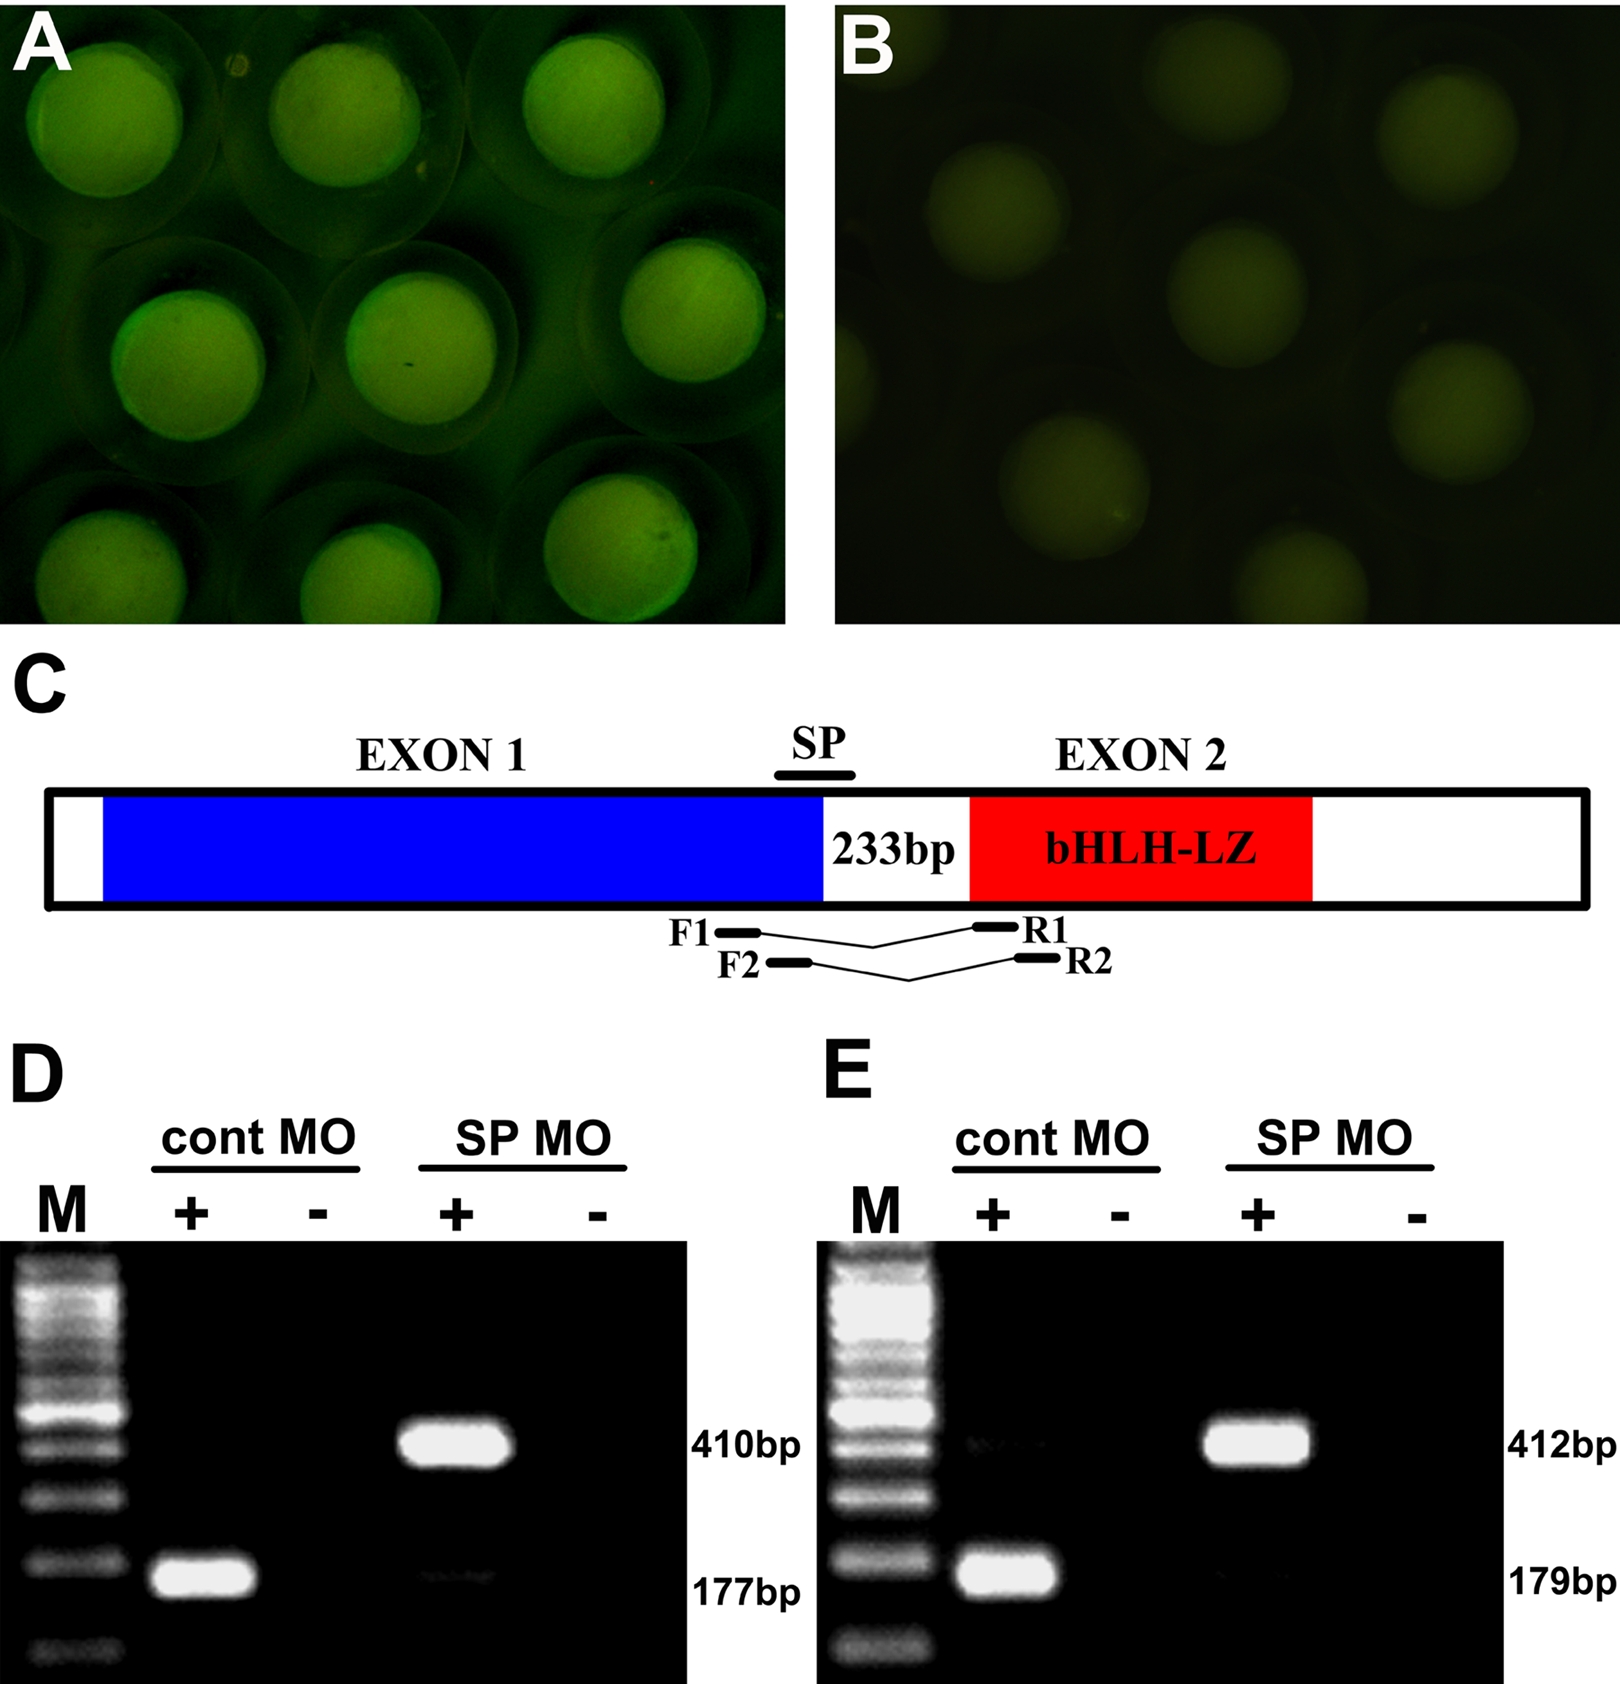
Fig. S1 Mych MO specificity. A–B. Mych:GFP signal detection at the bud stage after injection with (B) or without (A) mych UTR MO. C. Schematic drawing of mych SP MO design and two different sets of RT-PCR primers. D–E. RT-PCR shows that the SP MO eliminates the normal mature mRNA band. Embryos were collected at the 3-somite stage.
Acknowledgments
This image is the copyrighted work of the attributed author or publisher, and
ZFIN has permission only to display this image to its users.
Additional permissions should be obtained from the applicable author or publisher of the image.
Open Access
Full text @ PLoS One