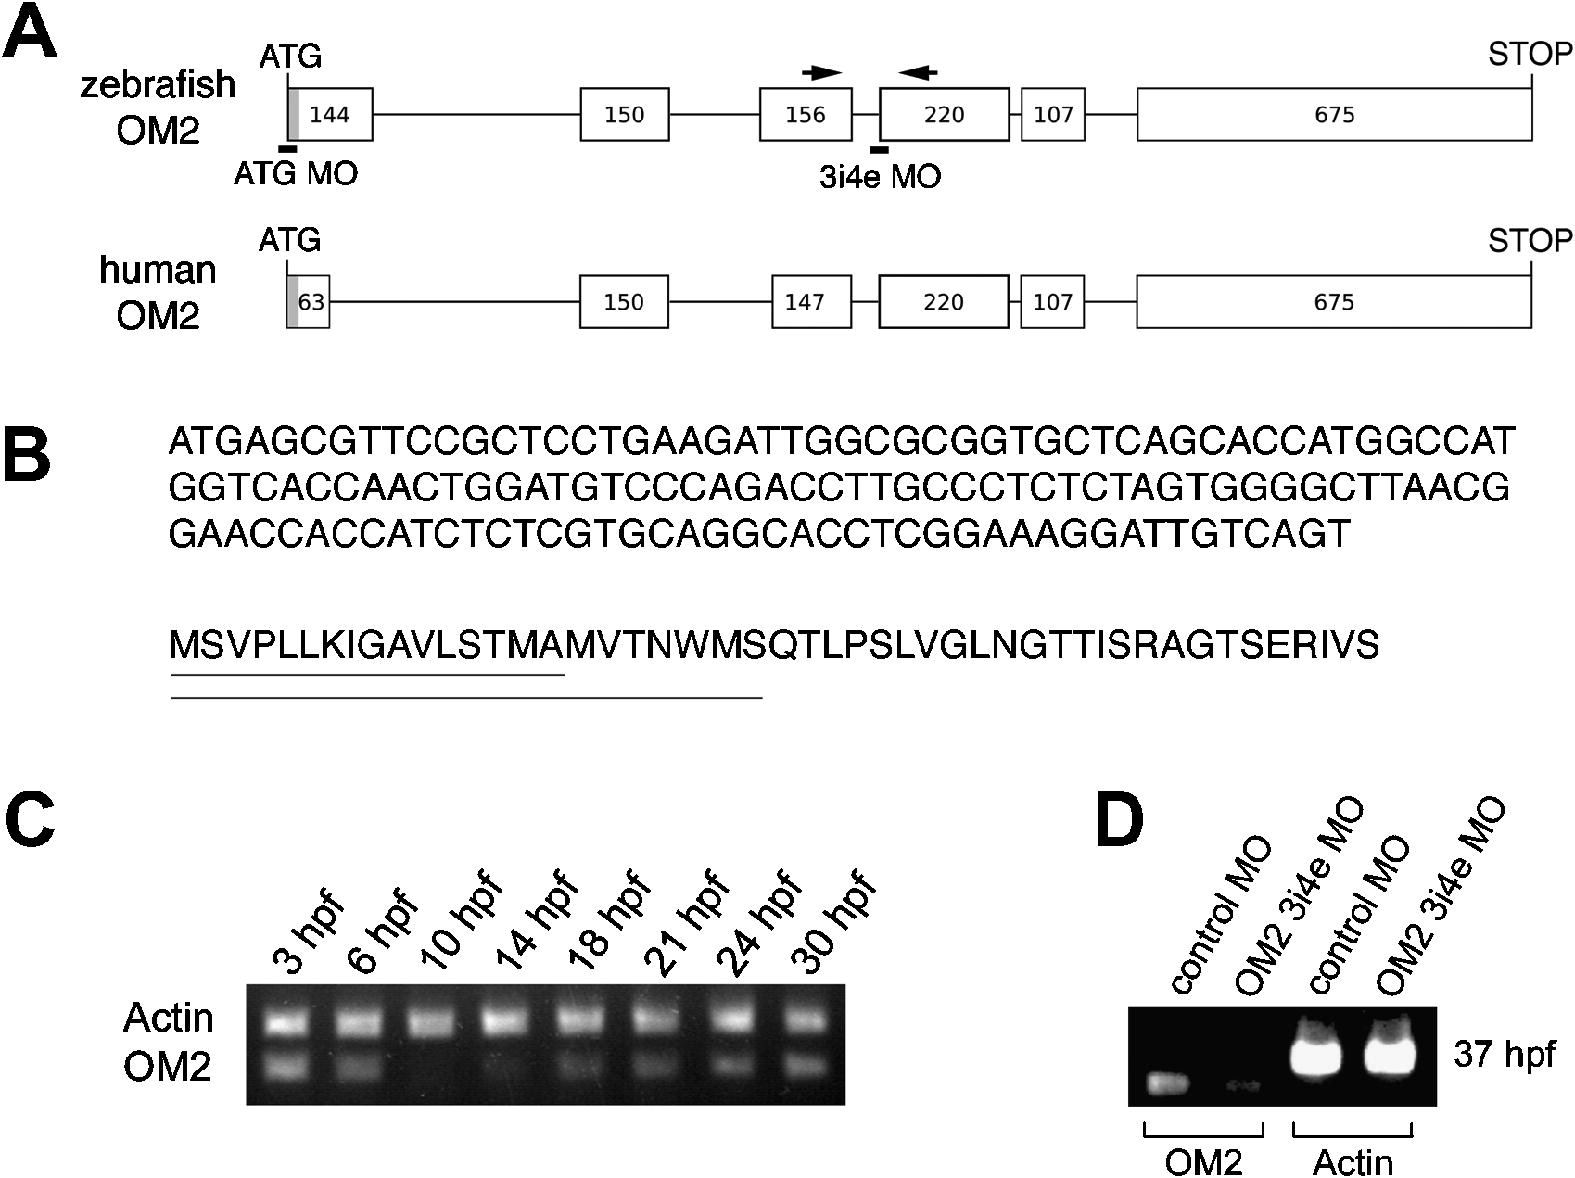
Fig. 1 Identification and expression of zebrafish olfactomedin 2. (A) Schematic representation of the zebrafish OM2 gene. The first exon includes the sequence obtained by 5′ RACE. The gray box at the 5′ end indicates a signal sequence-coding sequence predicted by the SignalP3.0 algorithm (http://www.cbs.dtu.dk/services/SignalP/). Numbers in exons (boxes) indicate the numbers of nucleotides. The positions targeted by the two MOs used in this study are indicated by black lines. Arrows indicate the primers used for RT-PCR to verify the efficiency of 3i4e MO (D). Intron lengths are not to scale. (B) Coding sequence of OM2 first exon and corresponding amino acid sequence. The underlines on the amino acid sequence indicate signal peptides predicted by SignalP 3.0 server using neural networks (top line) and hidden Markov model (bottom line). (C) Analysis of OM2 mRNA expression during zebrafish development using RT-PCR. (D) RT-PCR with cDNA from 37 hpf fish shows that the intron–exon boundary targeting morpholino (3i4e MO) specifically reduces mRNA with the correct splicing at the 3rd intron and 4th exon junction. OM2 primers used for this experiment are indicated in (A) (arrows). As a control, zebrafish actin mRNA level was not altered by OM2 3i4e MO, which indicates that disruption of mRNA splicing was specific for the target sequence.
Reprinted from Mechanisms of Development, 125(1-2), Lee, J.A., Anholt, R.R., and Cole, G.J., Olfactomedin-2 mediates development of the anterior central nervous system and head structures in zebrafish, 167-181, Copyright (2008) with permission from Elsevier. Full text @ Mech. Dev.

