
Fig. 5
- ID
- ZDB-IMAGE-080325-18
- Publication
- Hendricks et al., 2008 - Disruption of Esrom and Ryk identifies the roof plate boundary as an intermediate target for commissure formation
- All Figures
- Figures for Hendricks et al., 2008
|
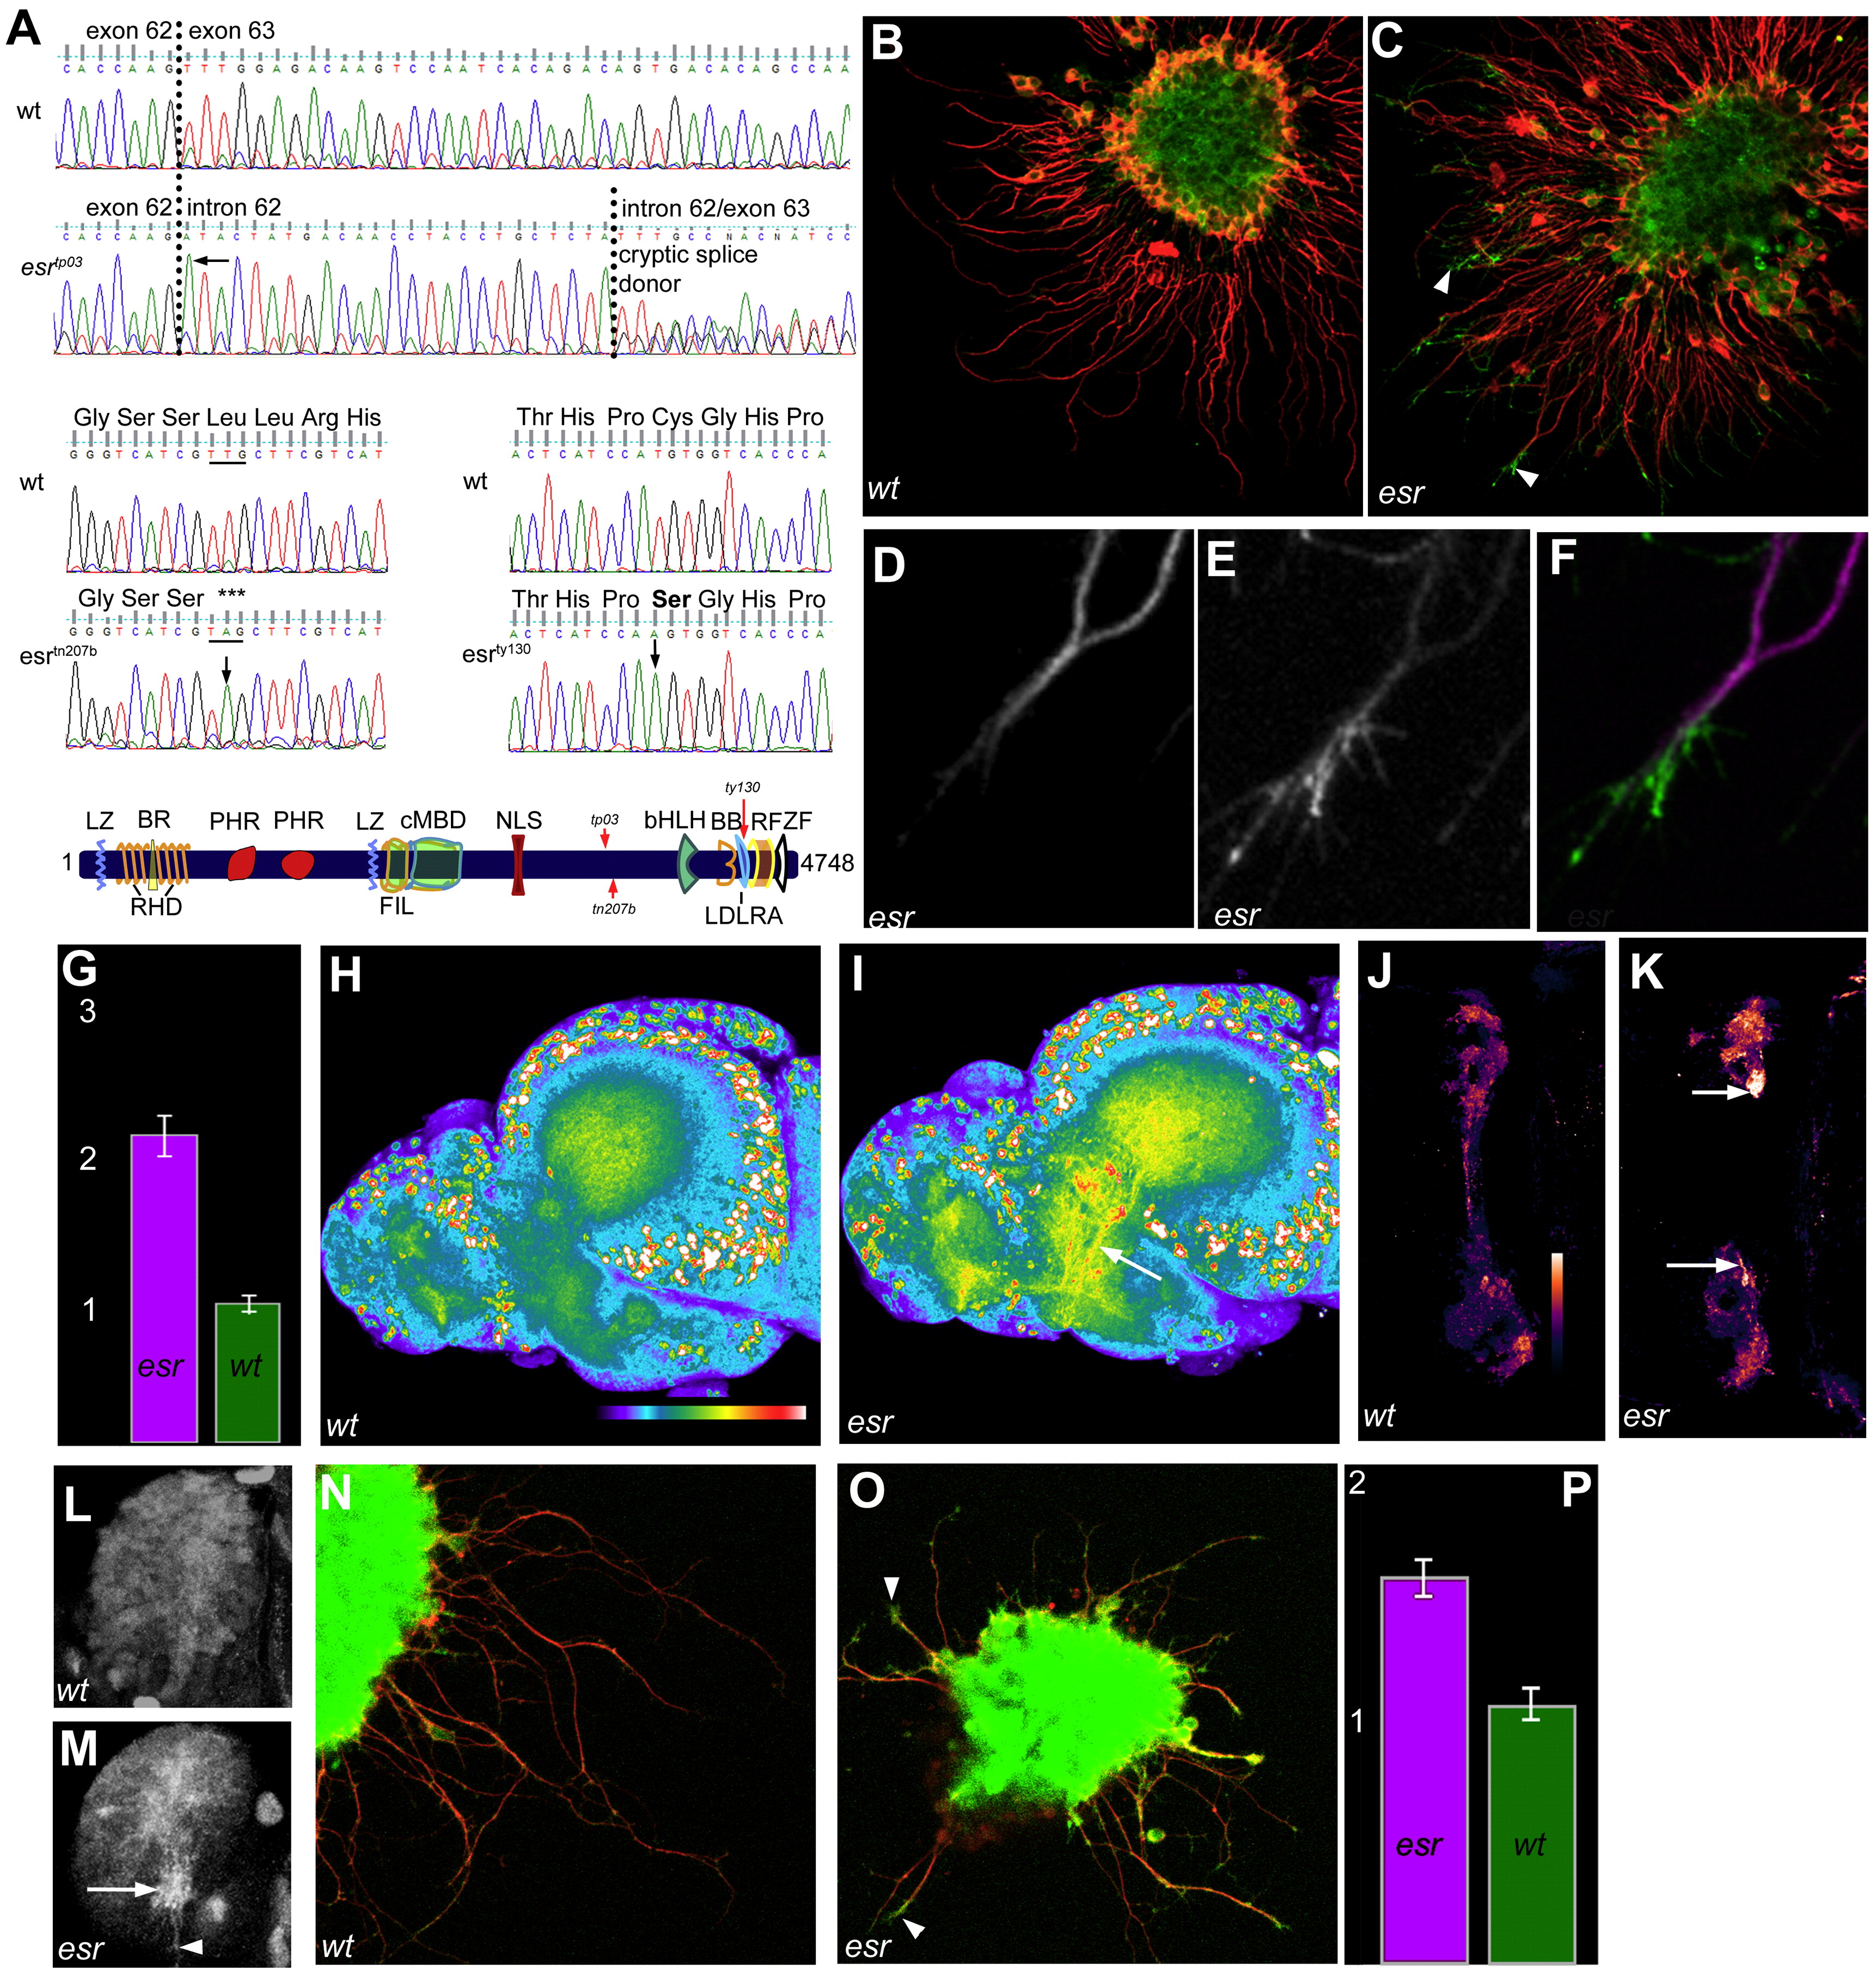
Fig. 5 Esrom regulates Tsc2 and 4E-BP1 in forebrain axons. (A) Mutations in three alleles affect the C-terminus of esrom. cDNA sequence in esrtp03 homozygous embryos includes intronic sequence after exon 62 due to a G to A mutation at the first position of intron 62 (arrow). This leads to two alternative transcripts, containing either all or part of intron 62, depending on the partial activity of a cryptic splice donor (causing double peaks). Either insertion causes a frameshift and premature stop codon in exon 63. This mutation eliminates an RsaI site, which can be used for genotyping. In esrtn207b embryos, a T to A mutation (arrow) causes a stop codon and creates an AluI site. The protein is predicted to be truncated at serine 3586. The esrty130 mutation, which causes a weaker phenotype, was previously characterized but mislabeled as esrtp03 (D’Souza et al., 2005). A cysteine required for disulfide bond formation in the LDLRA motif is changed to alanine due to a T to A mutation in exon 81. Domain structure of Esrom showing the positions of the three lesions described here. BB, b-box; BR, basic rich; LZ, leucine zipper; RHD, RCC1 homology; PHR, PAM, Highwire, RPM-1 repeats; FIL, filamin-like; cMBD, c-Myc binding; NLS, nuclear localization signal; bHLH, basic helix–loop–helix; LDLRA, low-density lipoprotein receptor type A motif; RF, RING finger; ZF, zinc finger. (B, C) Cultured forebrain explants double-labeled with anti-acetylated tubulin (red) and anti-Ser939 phospho-Tsc2 (green). Frequent enrichment of phospho-Tsc2 is evident in distal axons and growth cones of the mutant explant (arrowheads in C). (D–F) High magnification view of the distal end of a mutant axon, showing that phospho-Tsc2 levels (E) are increased in a pattern complementary to that of acetylated tubulin (D). (G) Average intensity of phospho-Tsc2 immunofluorescence in the growth cone of esrom (pink) and wild type (green) forebrain axons. The units represent relative intensity. Measurements are based on 20 mutant and 20 wild type clumps (Mann–Whitney p < 0.001). (H, I) Phospho-Tsc2 immunofluorescence of brains isolated from a wild type sibling (H) and esrom mutant (I). Higher level of staining is seen in axon tracts of mutants (arrow, I). Images are projections of confocal z-stacks. (J, K) In the habenula, axonal (SV2-colocalized) phospho-Tsc2, shown in pseudocolor, is elevated in mutants, especially medially (arrows). (L, M) Phospho-Tsc2 label in the habenula. In the mutant (M), intensely labeled bundles (arrow) and individual axons (arrowhead) can be seen extending toward the midline in the medial right habenula. These are not seen in the wild type (L). Anterior to the left, medial is down in (L, M). (N, O) Immunofluorescence for phospho-4E-BP1in forebrain axons of wild type (N) and esrom mutant (O). Stronger labeling is visible in the tips of mutant axons. (P) Average ± standard deviation of phospho-4E-BP1 intensity. Measurements are based on n = 10 wt and 10 mutant clumps; p = 0.008.
Reprinted from Molecular and cellular neurosciences, 37(2), Hendricks, M., Mathuru, A.S., Wang, H., Silander, O., Kee, M.Z., and Jesuthasan, S., Disruption of Esrom and Ryk identifies the roof plate boundary as an intermediate target for commissure formation, 271-283, Copyright (2008) with permission from Elsevier. Full text @ Mol. Cell Neurosci.