
Fig. 2
- ID
- ZDB-IMAGE-080211-33
- Genes
- Publication
- Lyons et al., 2008 - KBP is essential for axonal structure, outgrowth and maintenance in zebrafish, providing insight into the cellular basis of Goldberg-Shprintzen syndrome
- All Figures
- Figures for Lyons et al., 2008
|
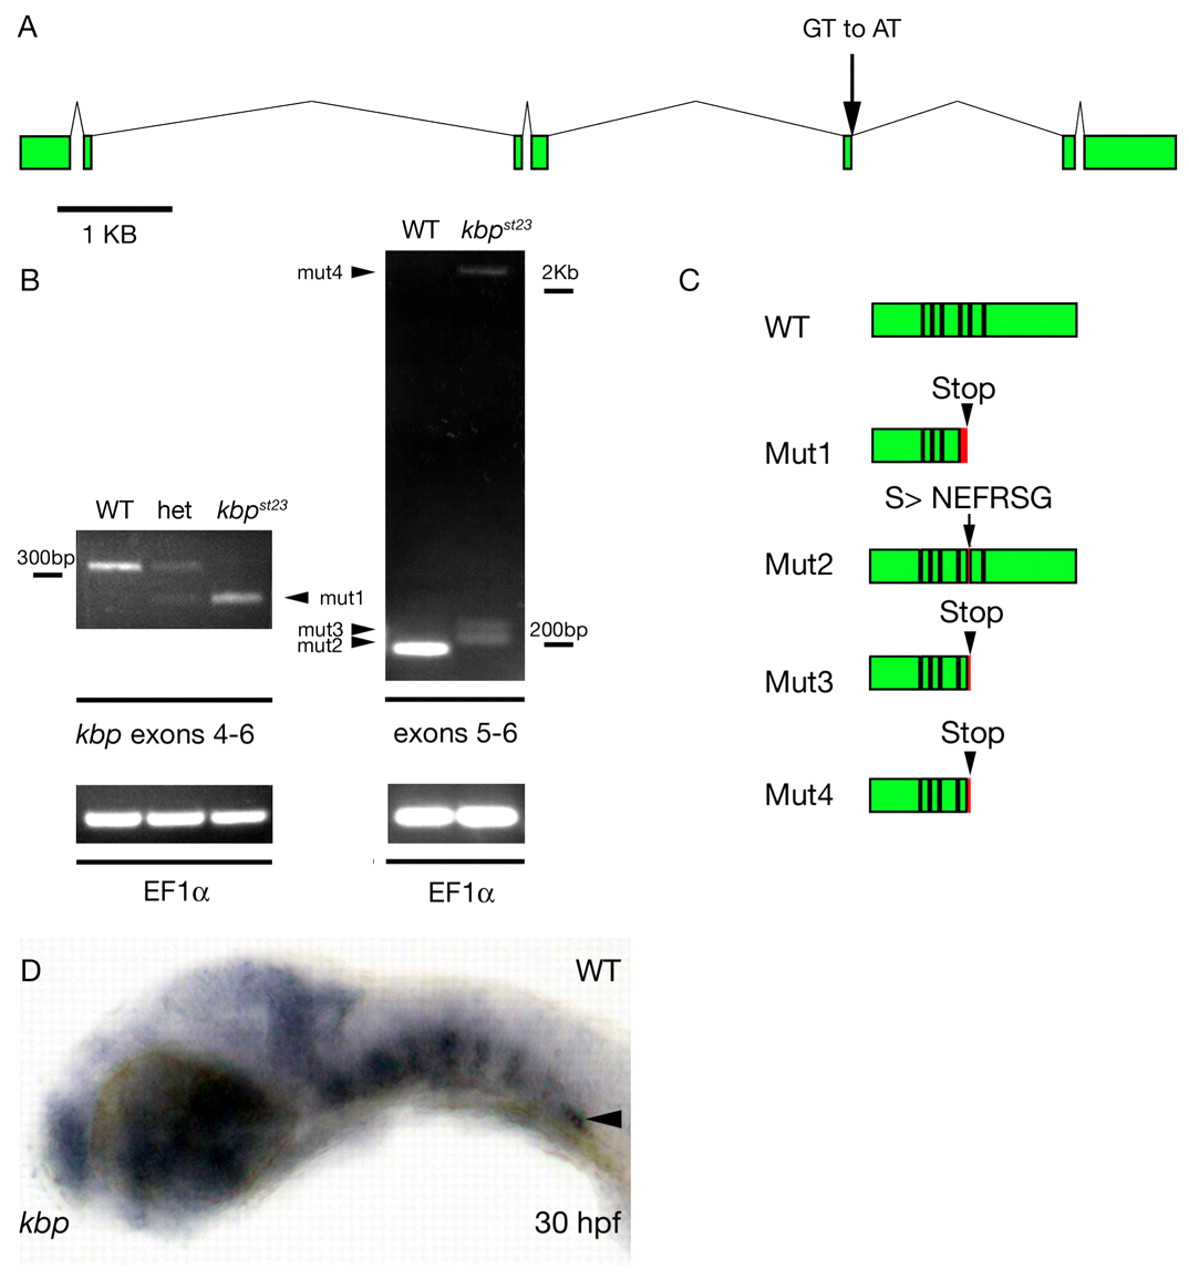
Fig. 2 The kbpst23 mutation disrupts the zebrafish kbp gene. (A) Genomic structure of zebrafish kbp. Green boxes indicate coding sequences of kbp exons. Scale bar is 1 kb. The splice donor disrupted by the st23 lesion is indicated by the arrow. (B) RT-PCR detects aberrant kbp transcripts in kbpst23 mutant larvae. Gel on left shows RT-PCR products generated with primers from exons 4 and 6 on RNA isolated from homozygous wild-type, heterozygous and kbpst23 mutant embryos. The lower mutant band, mut1 (arrowhead), reflects the deletion of exon 5 in the spliced mutant transcript. Gel on the right shows RT-PCR products generated with primers from exons 5 and 6 from RNA isolated from a mixture of larvae with wild-type phenotypes (i.e. homozygous wild type and heterozygous) and a group of kbpst23 mutant larvae. kbpst23 mutants have three weakly expressed transcripts (arrowheads) that result from aberrant splicing at the exon 5-6 junction. Below are loading controls showing that EF1α mRNA is robustly detected in all samples. (C) Schematic depicting the structure of the wild-type KBP protein and the abnormal products predicted to result from the four mutant kbp mRNAs. Red indicates regions encoded by intronic sequence and arrowheads indicate the positions of the premature stop codons predicted to truncate the proteins encoded by mutant mRNAs. Black lines separate coding sequences derived from different exons. (D) Lateral view of a wild-type embryo at 30 hpf showing kbp mRNA expression. Anterior is towards the left and dorsal is towards the top. The arrowhead indicates kbp expression in the posterior lateral line ganglion.