
|
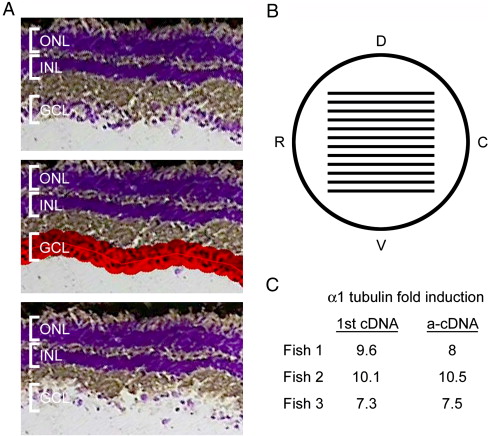
Fig. 1 Laser capture microdissection (LCM) of RGCs and linear amplification of RNA isolated from these cells. (A) Images of a cresyl violet stained retinal section before RGC capture (top), with area to be captured highlighted in red (middle) and after RGC capture (bottom) LCM. (B) Schematic lateral view of the fish eye with lines representing the distribution of sections taken for RGC harvesting. Dorsal (D), ventral (V), rostral (R), and caudal (C). (C) Quantitative RT-PCR results from 1st strand cDNA and amplified cDNA (a-cDNA) showing that α1 tubulin was induced as expected in optic nerve-lesioned RGCs and that amplification was linear and accurately reflected α1 tubulin induction. These samples were used to prepare probes for the microarray hybridization.
Reprinted from Developmental Biology, 312(2), Veldman, M.B., Bemben, M.A., Thompson, R.C., and Goldman, D., Gene expression analysis of zebrafish retinal ganglion cells during optic nerve regeneration identifies KLF6a and KLF7a as important regulators of axon regeneration, 596-612, Copyright (2007) with permission from Elsevier. Full text @ Dev. Biol.