
|
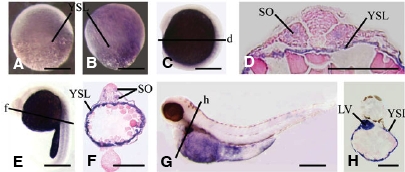
Fig. 2 Expression of agat in zebrafish embryos. Left side views for the whole mount, except where noted, with anterior up and dorsal to the right. (A) 50%-epiboly stage, showing that agat mRNA was first detected in the YSL. (B) 70%-epiboly stage, showing increased expression in the YSL. (C) 8-somite stage (13 h), showing agat expression in mature somites and the YSL. (D) Cross section of (C) through the line d. (E) 25-somite stage (21.5 h), showing strong expression in the YSL and weak expression in the mature somites. (F) Cross section of (E) through the line f. (G) Long-pec stage (48 h), left side view, with dorsal side up and anterior to the left. Expression of agat disappeared in the somites, but persisted in the YSL and appeared in the liver. (H) Cross section of (G) through the line h, showing strong expression in the liver and the YSL. LV, liver; SO, somite; YSL, yolk syncytial layer. Scale bar: 250 μm.