
|
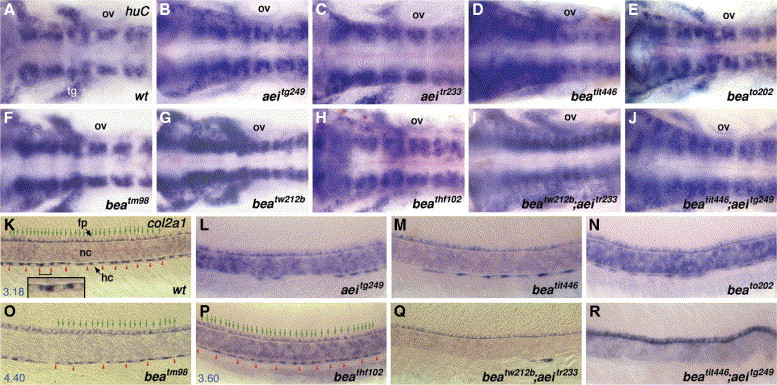
Fig. 1 Molecular phenotypes of bea, aei single and bea/aei double mutants during neurogenesis and hypochord formation. In situ hybridization of huC at approximately 30 hpf (A–J). Embryos of wild-type (A), aeitg249 (B), aeitr233 (C), beatit446 (D), beato202 (E), beatm98 (F), beatw212b (G), beathf102 (H), beatw212b; aeitr233 (I) and beatit446; aeitg249 (J). Note that the hindbrain neurons are increased in bea and aei single mutants as well as in bea/aei double mutants. Otic vesicle (ov) is the landmark for rhombomere 5. Lateral views of embryos labeled for col2a1 RNA expression at approximately 30 hpf (K–R). In wild-type embryo (K, fp/hc = 3.04 ± 0.32, n = 6), col2a1 is expressed in floor-plate (fp) cells and hypochord (hc) cells, immediately dorsal to and ventral to notochord (nc), respectively. Bracket denotes one hypochord cell, whose enlargement is shown in the insert. Each green arrow indicates a floor-plate cell; each red arrowhead indicates the boundary between two hypochord cells. The blue number at the bottom left corner is the number ratio of floor-plate cells to hypochord cells (fp/hc). Obvious gaps in hypochord can be seen in aeitg249 (L), beatit446 (M), beato202 (N) and beatw212b; aeitr233 (Q) mutants, indicating a reduction in the numbers of differentiated hypochord cells while putative double null beatit446; aeitg249 (R, n = 5) have no hypochord cells. Though there is no obvious gap, hypochord cells in beatm98 (O, fp/hc = 4.56 ± 0.47, n = 6) and beathf102 (P, fp/hc = 3.36 ± 0.17, n = 3) mutants are elongated and, therefore, reduced in number and increased in fp/hc ratio (compare the fp/hc ratio and/or the length of hypochord cell to that of wild-type embryos). All floor plate cells look normal. Anterior is to the left (A–R) and dorsal to the top (K–R). Abbreviation: fp, floor plate; hc, hypochord; nc, notochord; ov, otic vesicle; tg, trigeminal ganglion neurons. fp/hc ratio is expressed in average ± standard deviation format; n: numbers of examined embryos.
Reprinted from Developmental Biology, 286(2), Julich, D., Hwee, Lim C., Round, J., Nicolaije, C., Schroeder, J., Davies, A., Geisler, R., Lewis, J., Jiang, Y.J., Holley, S.A., Tübingen 2000 Screen Consortium., beamter/deltaC and the role of Notch ligands in the zebrafish somite segmentation, hindbrain neurogenesis and hypochord differentiation, 391-404, Copyright (2005) with permission from Elsevier. Full text @ Dev. Biol.